From Fundamentals to Trading Signals: The $UNI Case
Fundamentals are spreading on X.
However, these numbers make no sense until you act on them. I created a simple trading strategy that uses only fundamental revenue data and doesn't use tech analysis and all this classic trading stuff.
In this article I share my results for the $UNI token case study.
For informational and analytical purposes only. Not financial advice.
Trading using fundamentals
I picked up one of the most simplest tokens in Defi: $UNI. My goal is to show that fundamentals are for quiet, informed trading, not just shilling on X.
I backtested the trading strategy using just three numbers:
- Token Price (spot)
- Token Holders Revenue (30D)
- P/FCFt (30D)
A while ago I started to notice more and more setups that I called "revenue vs. price divergence", so I was curious if it is possible to convert this knowledge to money.
Long story short:
- rev-to-price divergence is a situation when an asset is temporarily undervalued or overvalued (according to my data).
- It's just my personal observation from data I built with my team at @valueverse_ai
- My hypothesis was: that if we could automatically identify such setups and long or short the token at a proper time, and wait when the market will re-rate the asset.
I decided to build on this divergence idea:
- Entry signal is always rev-to-price divergence - a situation when revenue grows or declines and asset price moves in the opposite direction (or not moves at all)
- Exit signal is just a time - 7D, 14D, 30D days after entry. I simply wait.
- Nothing else - l just applied Claude to my dataset using the API.
My results for $UNI
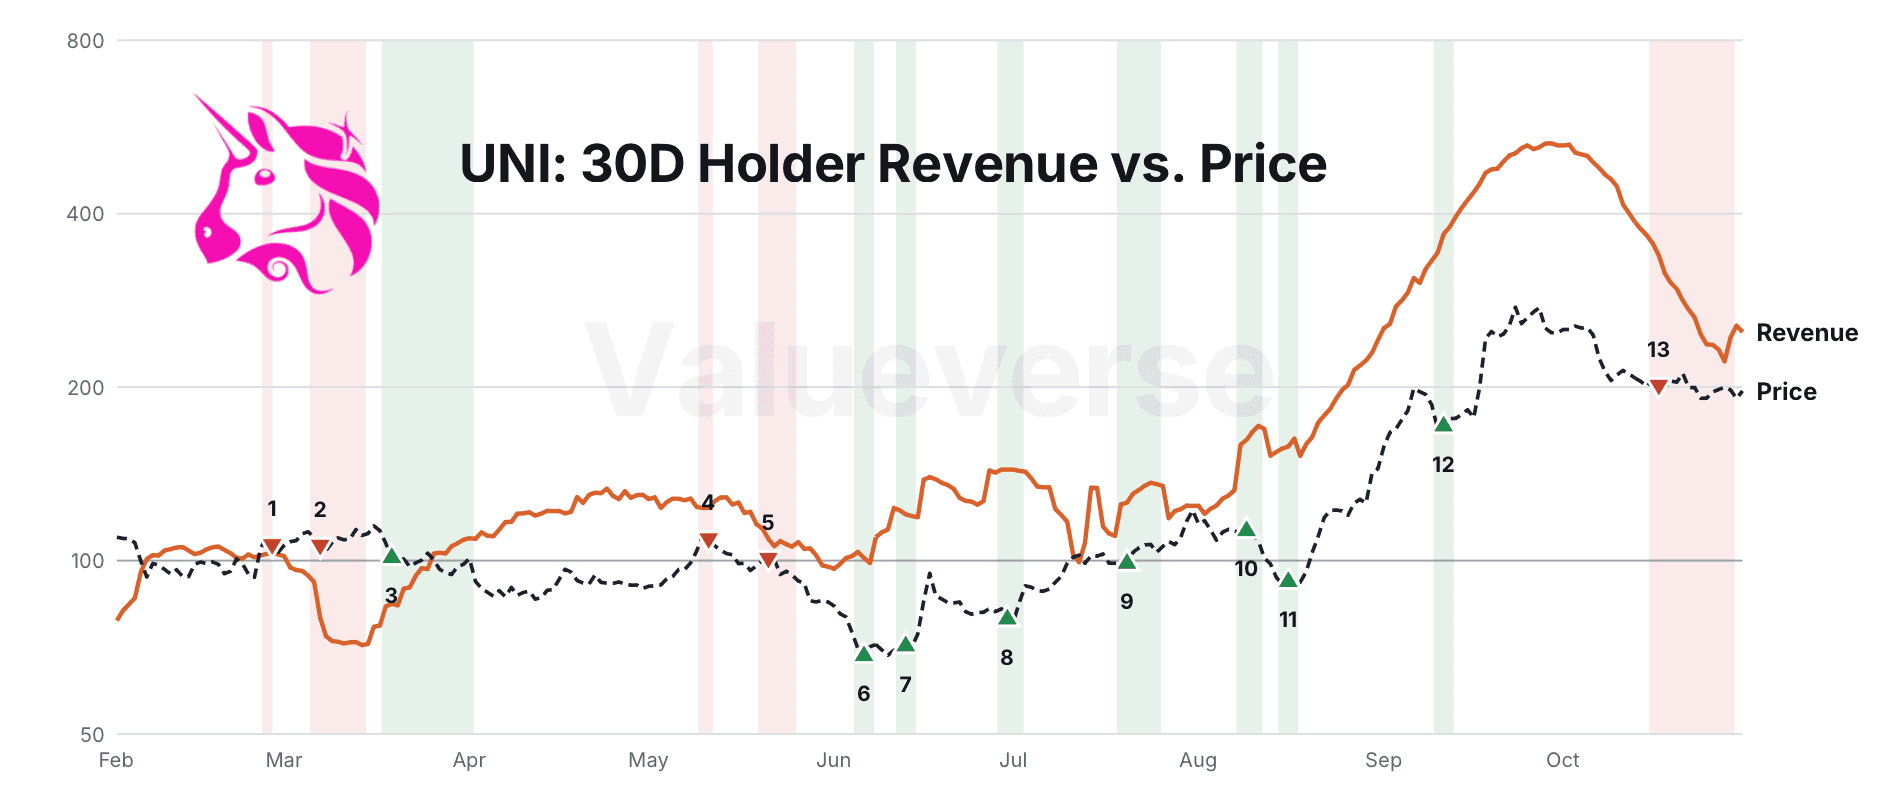
Applying the simple logic presented above, I found 13 divergence events.
So, thirteen trades with the following results:
- 76% (or 10/12) were profitable after waiting 30D
- 16.66% (or 2/12) resulted in small loss (-5% max)
- One trade is still ongoing (the 13th one)
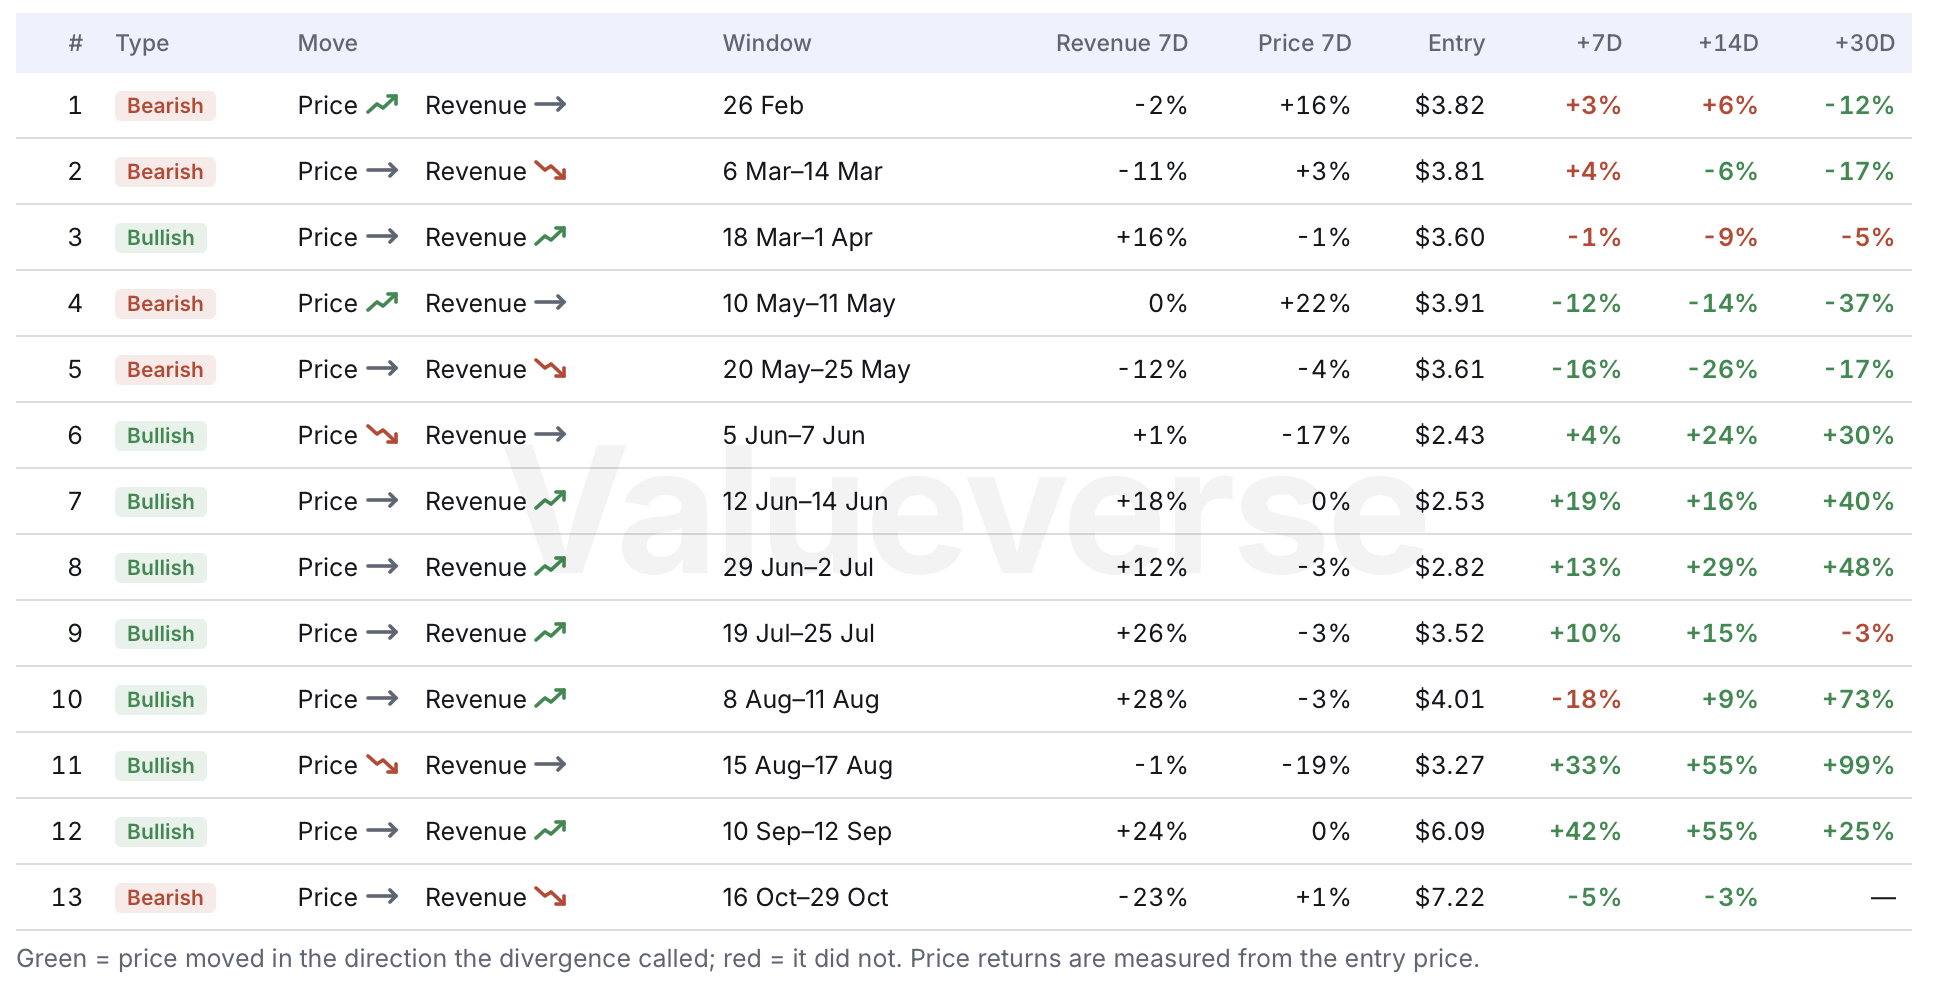
Uniswap native token $UNI price to holder revenue divergence events and trading results. Source: Valueverse data.
This is the overall charts with all trades:
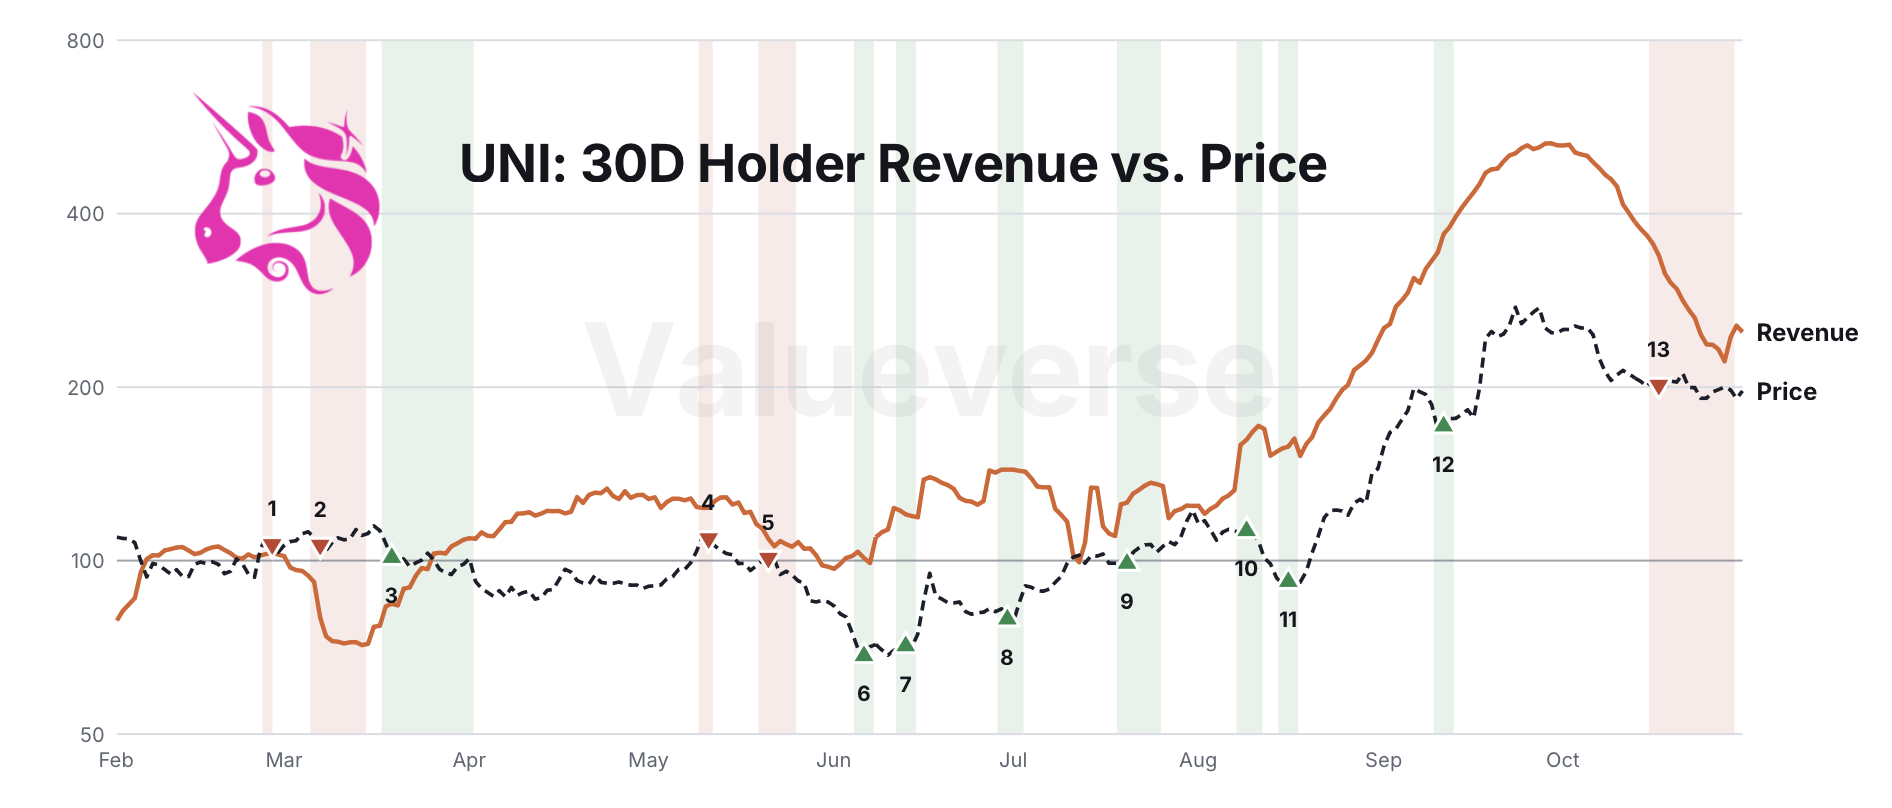
Uniswap $UNI token price vs. 30d holder revenue chart. Source: Valueverse data
Of course, it's interesting to zoom in into that:
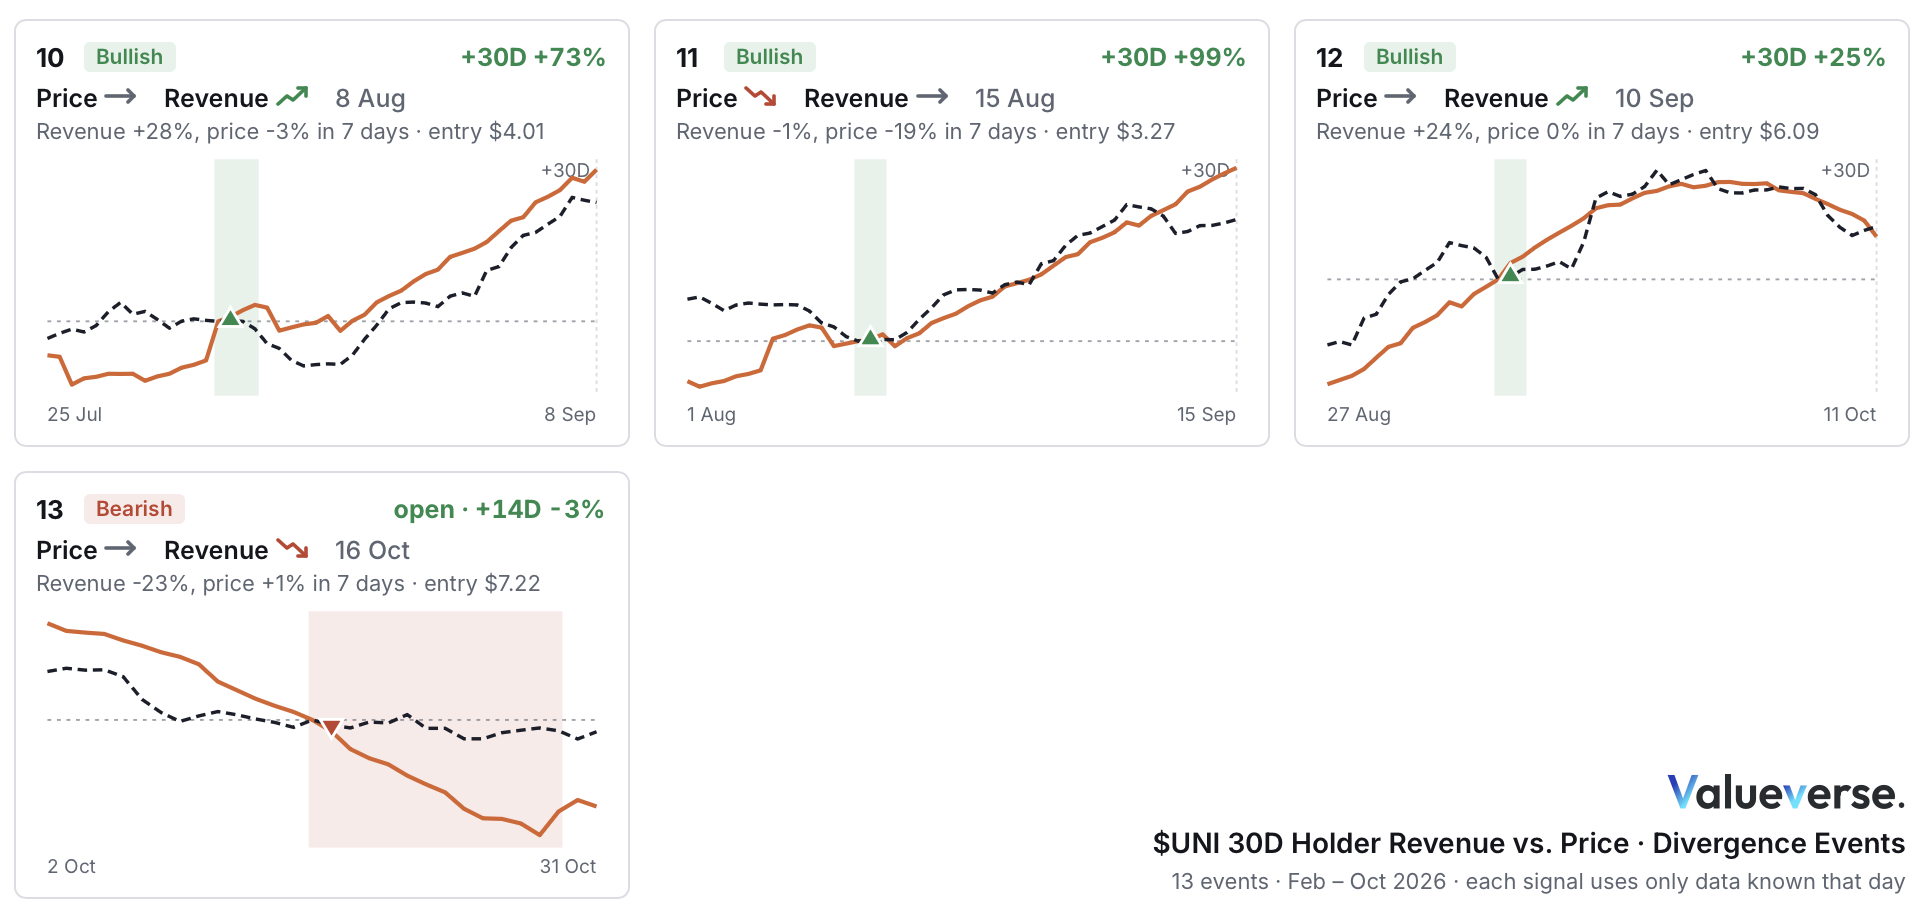
$UNI 30d holder revenue vs. price divergence events. Source: Valueverse data
Some details for those who still didn't understand where the edge comes from:
- Trade 11: during the period 7-15 August, revenue was steadily growing (+18%). At the same time, price made -19% - clear divergence.
- Trade 12: my favorite one. I even made a post in X regarding that. What happened: 10 Sep: 30d revenue grows, prices don't react at all. The market will catch it only in 6 days, so you have 6 days to buy cheap $UNI (vs. its revenue) and watch it re-rating +50% after that.
- Trade 13: currently ongoing. Price holds, revenue declines and already made -23% (and it's even accounting Binance hack market volatility that brought a lot of fees to $UNI!).
Using P/FCFt to improve results
After obtaining all these results, I decided to use my invention - P/FCFt multiple to see if it could improve results.
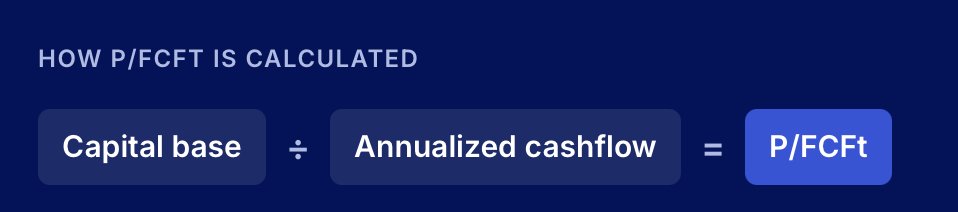
P/FCFt indicates the current price of $1 of future revenue during the next 365 days according to calculations assumptions
If P/FCFt is too high, it means that token is overheated (price is too high to the revenue it captures), and vice versa.
Following my rule #1, particularly - do everything as simple as possible, I did the following:
- Cut the trade (don't enter it): if P/FCFt 30D is higher than it's 30d mean, or P/FCFt/30d_p/fcft_average > 1 for bull trades, and <1 for bear
This rule is an additional filter since it shows how fast revenue accelerates or declines vs. price.
After cutting off trades using P/FCFt rule, there are 9 trades (100% profitable) and one still ongoing:
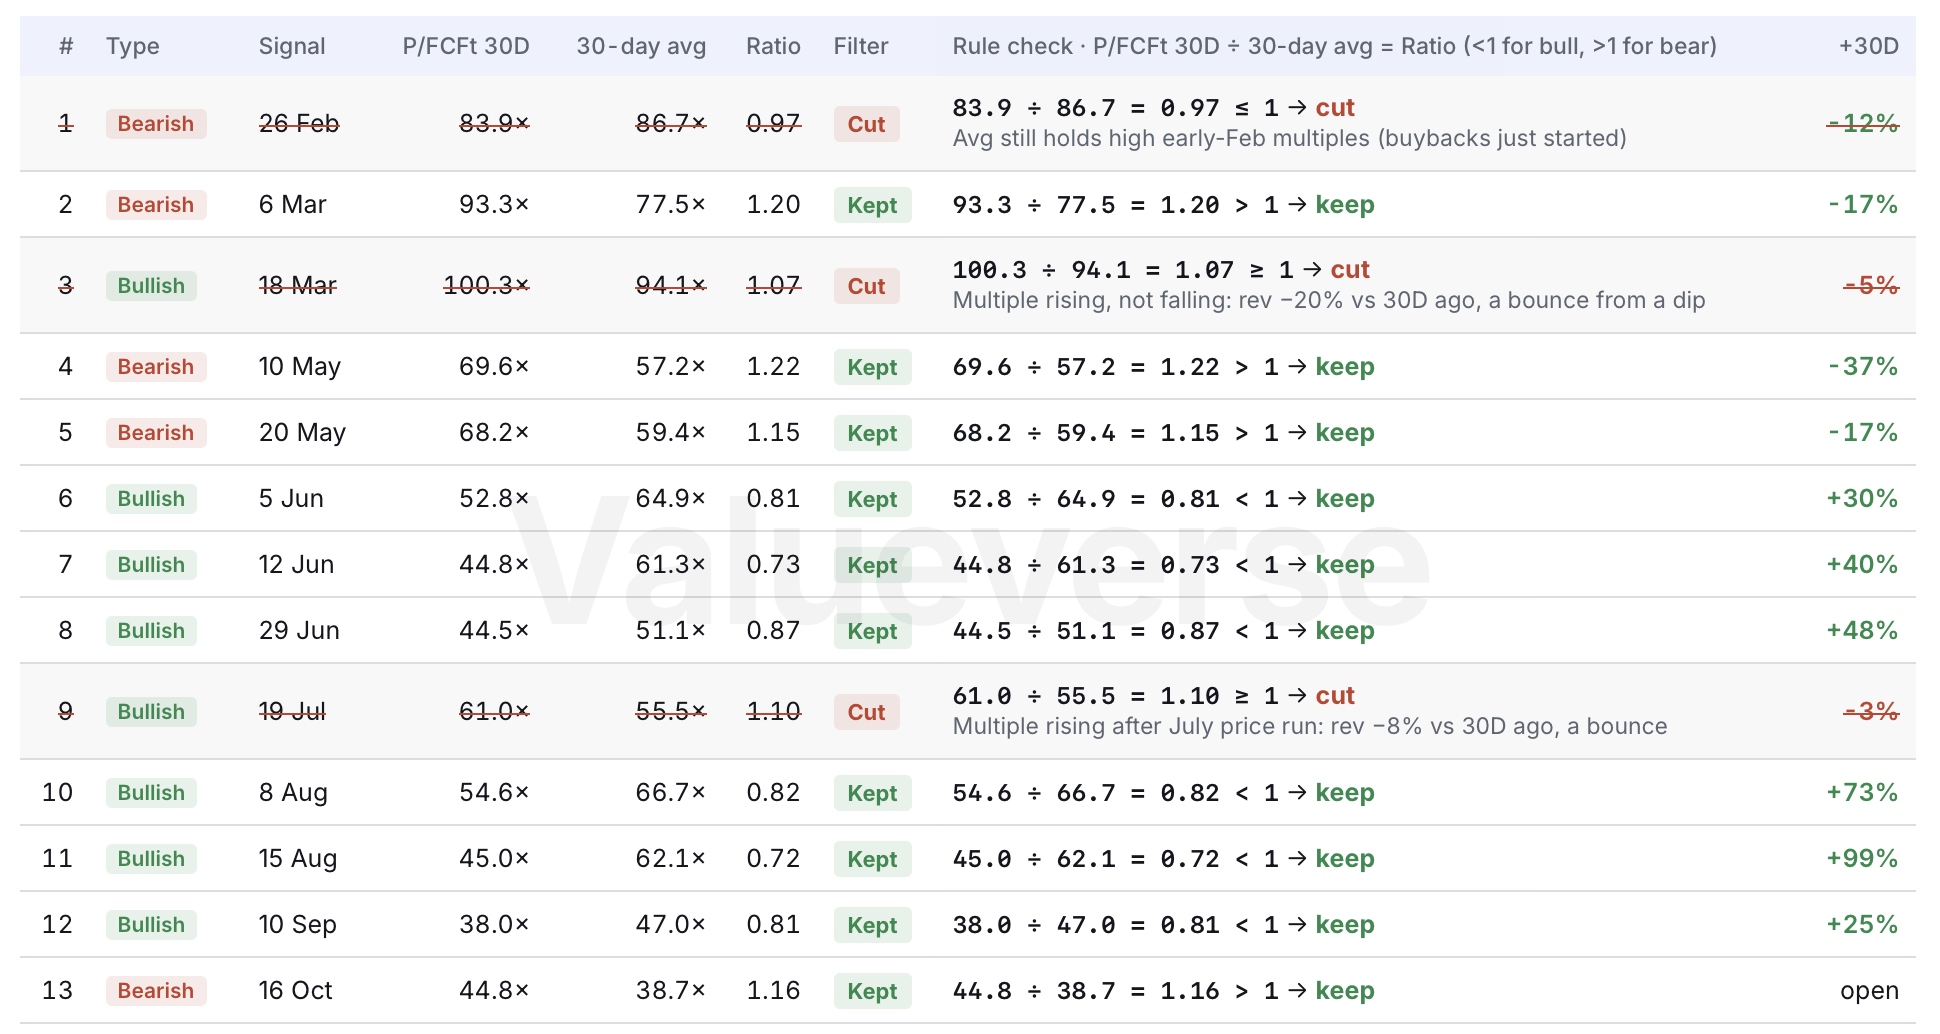
Trades using $UNI fundamentals (30D Revenue + P/FCFt rule)
Final Results
I created a strategy that uses only currently available fundamental data that I built with my team at @valueverse_ai.
Results are straightforward:
- 9/12 or 9/9 trades were profitable
- Without reading X, "trenches" and endless paid alpha groups. Just data.
- Really simple entry and exit.
I like the exit rule even more since I don't really want to decide when to sell (it is too complicated for me) -> this is why just the "30D and then sell" rule.
Since it is not financial advice I don't publish theoretical results "what if you invested something into this strategy".
Disclaimer: This article and the accompanying analysis are provided for research and educational purposes only. All token valuation frameworks, metrics, comparisons, and conclusions discussed herein are experimental in nature and may rely on incomplete, estimated, delayed, or incorrect data, as well as subjective assumptions and methodologies.
The presented analyses do not represent definitive valuations, forecasts, or assessments of financial performance, and should not be interpreted as statements of intrinsic value. Digital assets and tokens are highly volatile, and their economic characteristics may change over time.
Nothing in this publication constitutes investment advice, financial advice, legal advice, or a recommendation to buy, sell, or hold any asset. Readers are solely responsible for their own research, risk assessment, and investment decisions.