Pricing the Revenue: Effective Revenue Multipliers
Revenue multipliers is a common and widely adopted approach for valuing shares of companies in TradFi.
During the 2025, the number of revenue-sharing assets in crypto significantly increased. The major protocols such as Hyperliquid, AAVE, Uniswap, Lido, Jito, and many others implemented various approaches for sharing revenue with their holders (mainly buybacks).
This led to a fundamental shift: investors started to evaluate tokens not only by indirect performance metrics, such as TVL, market share, or number of active wallets; but also by direct financial metrics such as fees distributed to token holders in various forms.
Twitter got overflooded with P/S or P/E posts with multipliers, proving that something is under- or overvalued.
However, tokens are not stocks and have some unique features that require additional effort to calculate multipliers that truly reflect token cashflows (and are distinguished from general protocol metrics).
In general case:
- not all tokens receive revenue
- not all protocol revenue is distributed to token holders
In specific cases it can be true (all tokens receive all revenue); but in many other cases it is incorrect.
MCap/Revenue and FDV/Revenue are distorted analogs of P/S from the TradFi. In Web3 Mcap or FDV quite often is not equal "equity eligible for cashflow"
In this article we introduce the concept of Effective Revenue Multipliers - the token-specific metric that takes into account token design features and revenue flows within the system.
Mapping revenue and its recipients
We applied Valueverse’s original Token Classification Framework (describes tokens’ value origins and related economic mechanisms) to identifying token cashflows and eligible recipients.
Such an approach allows us to map:
- All cashfllow sources available to token holders
- Conditions for receiving cashflow (which could be unique to each source)
- Revenue received from each cashflow source
The simplest example is buybacks vs. veTokenomics:
- In the case of buybacks, all liquid supply receives cashflow
- In the case of veTokenomics, however, only the vote-escrowed tokens locked in the ve contract do.
Note that veTokenomics could also have various implementations:
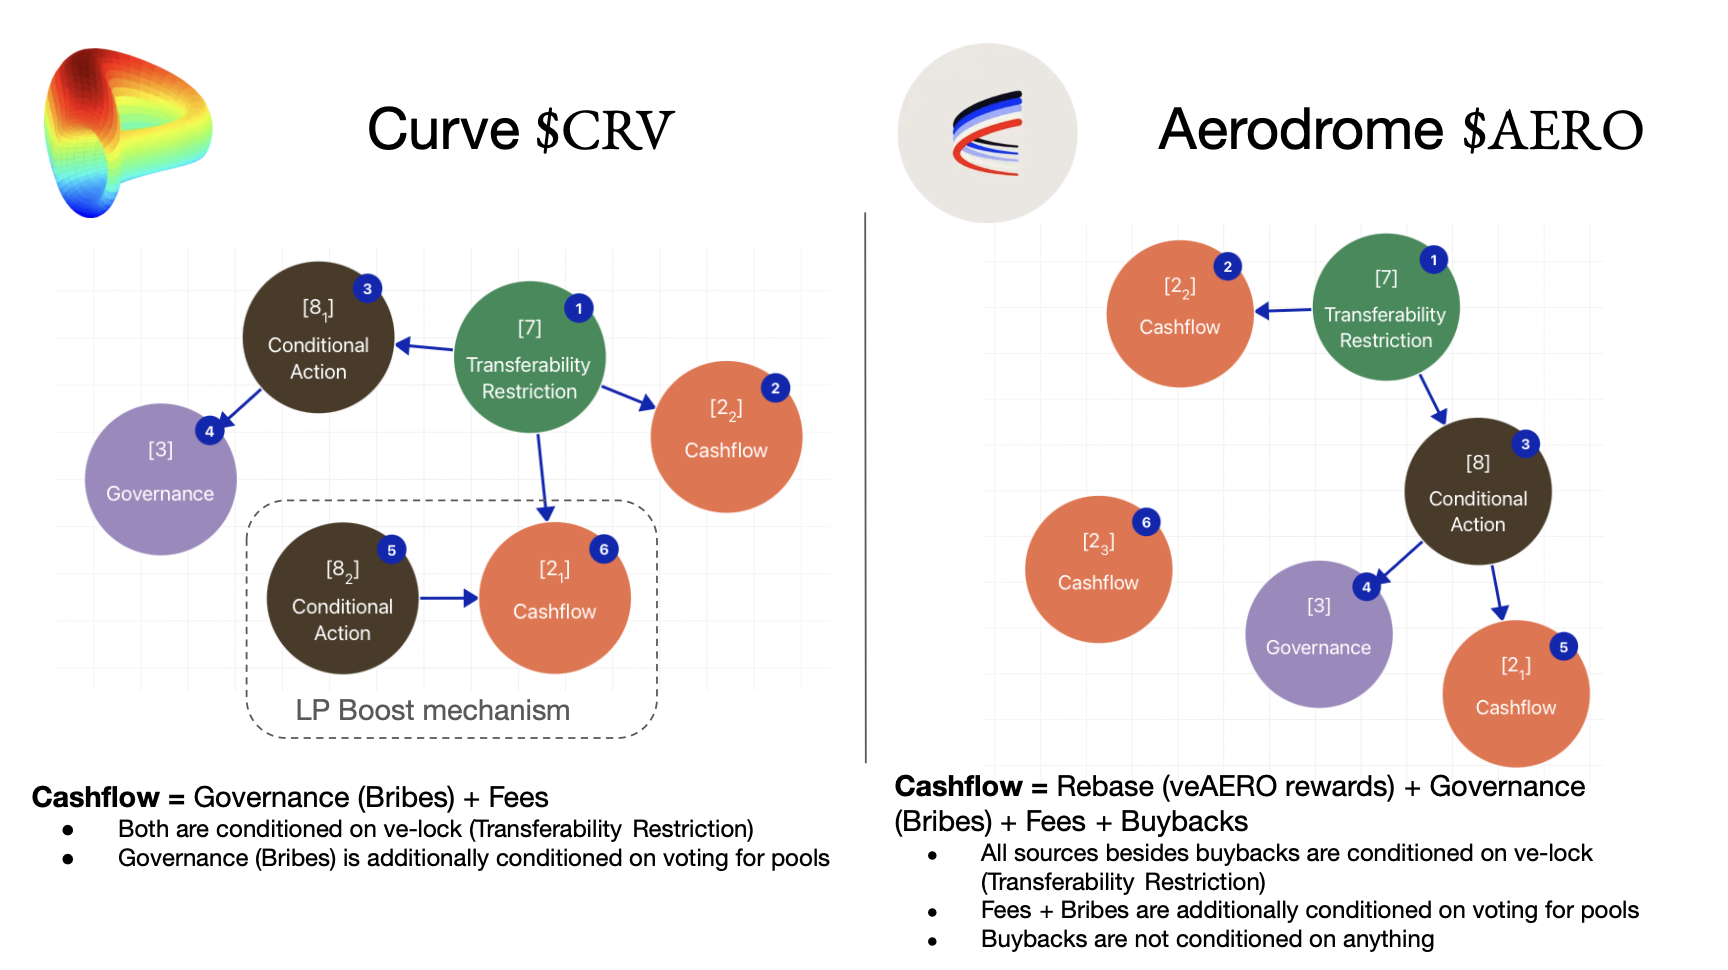
Looks complicated, doesn't it? This is how value-capturing token analysis looks like.
Easy mode for fundamental analysis: Revenue Multiplier that accounts for all token design features at once.
Effective Revenue Multiplier
Introduction
The Effective Revenue Multiplier (ERM) is a metric that accounts only for the cashflow received by tokens that are eligible to receive it.
It indicates the current price of $1 of future revenue during the next 365 days according to calculations assumptions (see below).
In general case, it is calculated as Effective M.cap (accounts for the market valuation of token supply receiving the cashflow) divided by the cashflow received by this M.Cap:
where:
- S(t) is a revenue-receiving token supply function
- P(t) is a token price function
- CF(t) cashflow received by token holders during the period t (annualized according to the function)
The above formula is only correct by itself for a single origin of value (or, more properly, a single subset of revenue-receiving tokens that is conditioned on the same predicates).
It is best to compute the ratio of sums if an asset has several cashflow origins and recipient subsets.
Naming analogies that are suitable for Effective Revenue Multiplier:
- Price-to-Cashflow Eligible (P/CFe)
- Effective Price-to-Cashflow (Effective P/CF)
- Revenue-Eligible Market Cap / Cashflow
Calculation approaches
The simplest approach:
- S, P are constants (values at the moment of calculation)
- CF is a distributed cashflow during the observation period and is assumed to be constant in all future periods for annualization.
Clearly, the simplest case is a “napkin style” approximation because supply, price, and cashflow are constantly changing. However, it is useful for quickly comparing asset revenue pricing.
A very simple example
There is protocol with 1,000 tokens circulating supply, Price is $1
- 500 tokens are locked in veTokenomics with the permanent max lock (500 veTokens). Only veTokens receive protocol fees, and for all periods only 500 tokens were max locked.
- Protocol distributed $5 in 7D, $30 in 30D, $100 in 90D, $200 in 180D
- Then, the Multiplier is: 1.92x 7D, 1.37x 30D, 1.23x 90D, 1.23x 180D
Analysis results
- Currently, $1 of future fees costs $1.92
- Token revenue has declined in recent periods compared to past periods.
- If a hypothetical token with a similar structure has a 3x multiplier, its price of revenue now is 1.56 times more expensive (3x/1.92x).
By tracking these numbers every week and taking into account all changes (cashflow, locked supply, and token price), we can see how revenue pricing evolves for one protocol versus another.
Sophisticated approach:
- Each variable is a function itself
- Cashflow includes growth/decline projections (models)
- Supply includes growth/decrement assumptions as well
In our reports, we track valuation multiples calculated using trailing revenue over multiple sliding window sizes (7D, 30D, 90D, 180D, and 365D).
At this stage, we apply a simplified methodology for educational and illustrative purposes. For selected tokens, we plan to introduce a more sophisticated, state-aware valuation framework in future iterations.
Comparison with popular multipliers
Below, we compare the effective revenue multiplier with other multipliers that are frequently used in the analysis of value pricing for Web3 assets.
TL;DR: Drawbacks of P/F and P/S in token revenue pricing:
- Protocol revenue ≠ tokenholder revenue
Protocols can generate substantial revenue while token holders receive little or none of it. - Incorrect supply assumptions
P/F and P/S implicitly assume that all circulating tokens have equal revenue claims, ignoring eligibility constraints. - Distorted valuation signals
Revenue distributed to a small subset of supply can make tokens appear undervalued despite weak actual cashflow capture.
Table: Comparison of popular P/F and P/S with Efficient Revenue Multiplier:
| Multiplier | ERM | P/F | P/S |
|---|---|---|---|
| General properties | |||
| Type of metric | Token-focused value metric | Protocol-level metric | Protocol-level metric |
| Use Case | Token-level valuation, revenue pricing analysis, forecasting | Cross-protocol comparison | Cross-protocol comparison |
| Economic question answered | How expensive is the token relative to the cashflow it captures? | How expensive is the protocol relative to fees? | How expensive is the protocol relative to revenue? |
| Analogy in TradFi | Effective P/FCF (adjusted for eligibility) | EV / Gross Fees | P/S (equity proxy) |
| Sensitivity Analysis | Supports partial derivatives and factor decomposition | Limited | Limited |
| Calculation methodology | |||
| M.Cap calculation | Revenue-eligible market value (price × eligible supply) | Circulating Market Cap (price × circulating supply) | Circulating Market Cap (price × circulating supply) |
| Supply calculation | Only tokens eligible to receive cashflows | Circulating supply (all liquid tokens) | Circulating supply (all liquid tokens) |
| Revenue calculation | Cashflow distributed to eligible tokenholders, annualized | Fees (gross protocol fees, annualized) | Revenue (net protocol revenue retained by the protocol) |
| Revenue attribution | Tokenholder-level (actual value capture) | Protocol-level (before token capture) | Protocol-level (before token capture) |
| Cashflow per token | Core component of the metric | Not addressed | Not addressed |
Effective Multiplier: all-in-one token metric
According to the formula, the Multiplier value depends on Supply, Price, and Cashflow.
Thus, it is a single metric for three most important features of the asset:
- Practical utility measured as cashflow (so-called “demand side” in token engineering)
- Supply and its dynamics (so-called “supply side” in token engineering)
- Token price (the market-driven evaluation of practical utility vs. supply)
Note: This is not a static valuation metric, but rather a projection of a Token Value State, which is defined by three interdependent variables.
Tracking the past and forecasting the future values of this metric, we take into account everything at once: token utility, unlocks, and market behavior.
In the current model, only cashflow is accounted for in the token utility mechanics. However, it can be extended to include governance and access types of utility.
The Token Value State can be schematically represented by a Value Triangle:
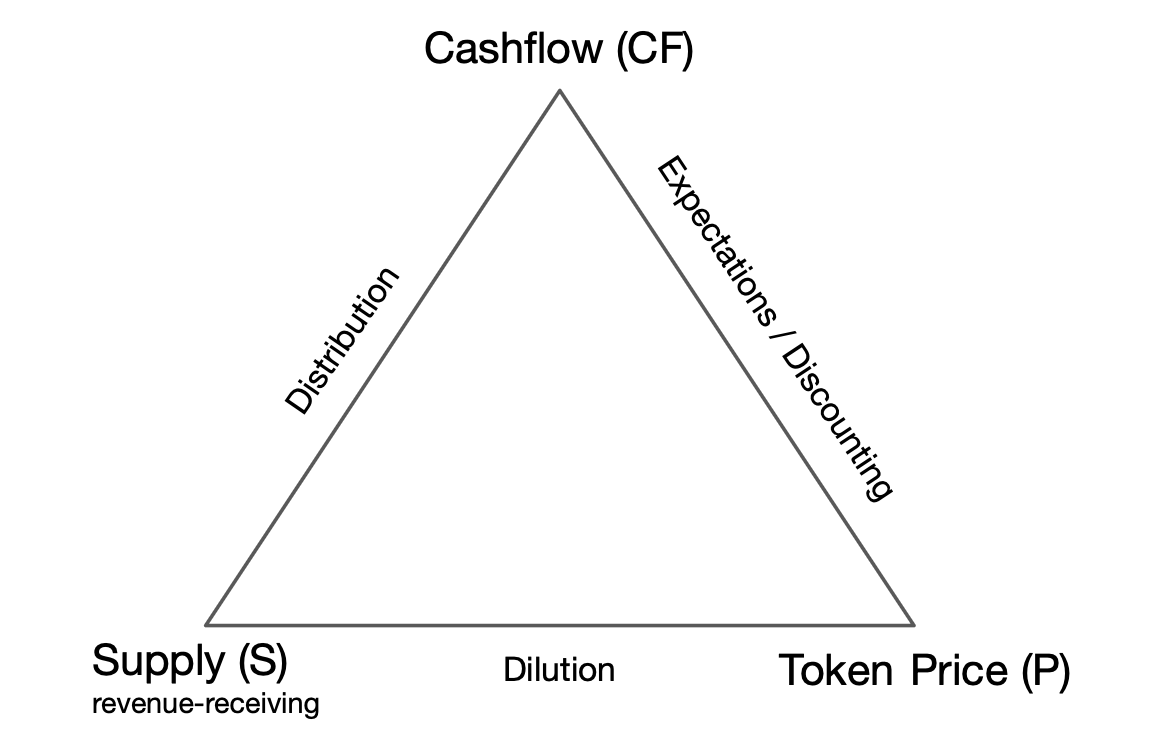
Changing any of three variables changes the Effective Multiplier. However, in the general case, all three variables change over time, even across the 7D window.
Below we provide an explanation of triangle faces, each of which encapsulates an aspect of token valuation conditioned on the variables placed in the vertices of the corresponding edge.
Cashflow ↔ Supply (Distribution)
- Cashflow per revenue-receiving token
- Cashflow dilution (change in supply with cashflow kept constant)
- Revenue per token growth (change in cashflow with supply kept constant)
Cashflow ↔ Token Price (Expectations/Discounting)
- Market pricing of future cashflows
- Expectations expanding / compressing
- Fundamentals vs. narrative/hype
Supply ↔ Token Price (Dilution)
- Revenue-reciving Supply growth and decrement pricing
- Unlocks vs. buybacks, Staking vs. Unstaking, veToken locks vs. unlocks
- reflexivity between value-receiving Supply and Price
Supplementary: factor decomposition
Effective multipliers could be used to conduct detailed research on the assets value pricing. The application space is quite rich and is the subject of ongoing academic work by Valueverse.
The simplest example: utilizing partial derivatives to explore how isolated changes affect the value state:
Given the multiplier:
Partial derivatives:
Interpretation:
- ∂M/∂S: Sensitivity to the dilution or expansion of revenue-eligible supply. This occurs when revenue-receiving supply grows while prices and cashflow remain unchanged.
- ∂M/∂P: Sensitivity to a pure price re-rating (when the price increases but the revenue and supply remain the same, causing the valuation to grow).
- ∂M/∂CF: Sensitivity to fundamental performance is always negative. This means that if revenue grows while price and supply remain unchanged, the multiplier and valuation will decrease.
Disclaimer
This article is for educational and research purposes only. The multiplier framework and related analysis are simplified and illustrative, and do not constitute financial or investment advice. Digital asset economics and cashflow mechanisms may change over time, and past behavior does not guarantee future results. Readers should conduct their own research before making any decisions.