
The Value State 001
The Value State is a weekly report of financial metrics for digital assets.
It tracks assets' revenue and utility highlights.
We expect the industry to accelerate its shift towards tokens with real value and revenue in 2026. This is the first experimental release to cover these matters.
Financial metrics overview
Below we provide revenue multipliers for selected productive assets, generating revenue for their holders.
| Asset | eff_mcap | 7D | 30D | 90D | 180D | 365D |
|---|---|---|---|---|---|---|
| YB | 25,723,056 | 7.9 | 1.61 | 1.62* | ||
| CRV | 360,942,969 | 19.86 | 16.44 | 10.19 | 7.59 | 7.44 |
| AERO | 564,726,655 | 5.59 | 5.74 | 3.65 | 3.12 | 2.67 |
| VELO | 30,732,307 | 8.41 | 8.32 | 5.44 | 4.54 | 3.09 |
| PUMP | 1,482,665,845 | 3.17 | 3.34 | 1.47 | 4.57* | |
| HYPE | 11,915,797,980 | 17.78 | 17.74 | 15.79 | 15.6 | 15.29* |
| AAVE | 422,993,627 | 15.01 | 17.41 | 18.31 | 18.95 | 17.87 |
Disclaimer: The effective market cap / revenue metrics shown are experimental and illustrative, may be inaccurate, and are provided for educational purposes only. This is not investment advice.
The detailed metrics for each asset can be found on the corresponding Valueverse asset tracking page (the $TICKER link in the table).
What do these multipliers mean?
Effective M.Cap/Revenue is a metric that can be used to track the revenue of digital assets. It is a token-specific metric intended as an alternative to the currently used protocol-specific M.Cap/Revenue and FDV/Revenue metrics.
It is similar to an M.Cap/Revenue metric, but only accounts for tokens that receive revenue and revenue distributed to token holders.
Eff_Mcap/Revenue shows the price a token purchaser pays for $1 of annual revenue if all conditions remain the same.
Of course, these variables change rapidly and do not account for future revenue growth models. Therefore, it is a relative metric that is useful for comparing projects.
The Value State discussion
All assets except for $AAVE are utility tokens of decentralized exchanges.
- For $YB, $AERO, $VELO, and $PUMP holders, the main source of revenue is trading fees.
- $CRV is a unique asset that generates more value from governance proceeds (bribes) than from swap fees (73.4%). The bribe share of income for $AERO and $VELO is only 12% and 17%, respectively.
Volatility and revenue decreased significantly after October 10th. This is demonstrated by the 90D metric, which is much lower than the 7D and 30D timeframes. This means that the revenue of the exchanges was much higher before October 10th.
Historical 365D is only available for $CRV, $AERO, and $VELO.
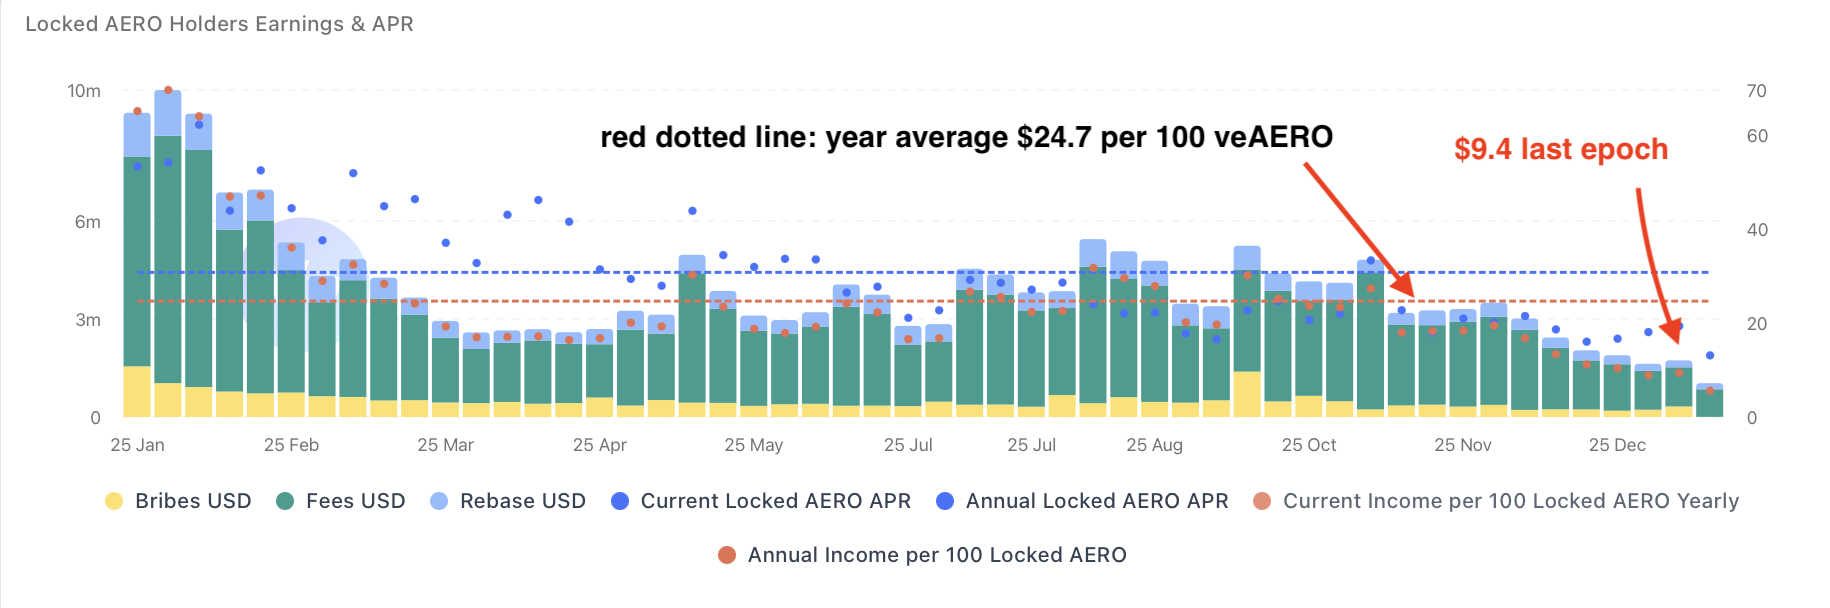
For $AERO and $VELO, the multiplier is lower than at any other time, meaning that protocols generated more revenue on average during the year than at any other recent time:
https://app.valueverse.ai/tokens/aerodrome-finance#key-metrics
For $CRV it is almost equal with 180D which demonstrates consistency of revenue generation during all timeframes besides recent 2 months where total fees & bribes decreased:
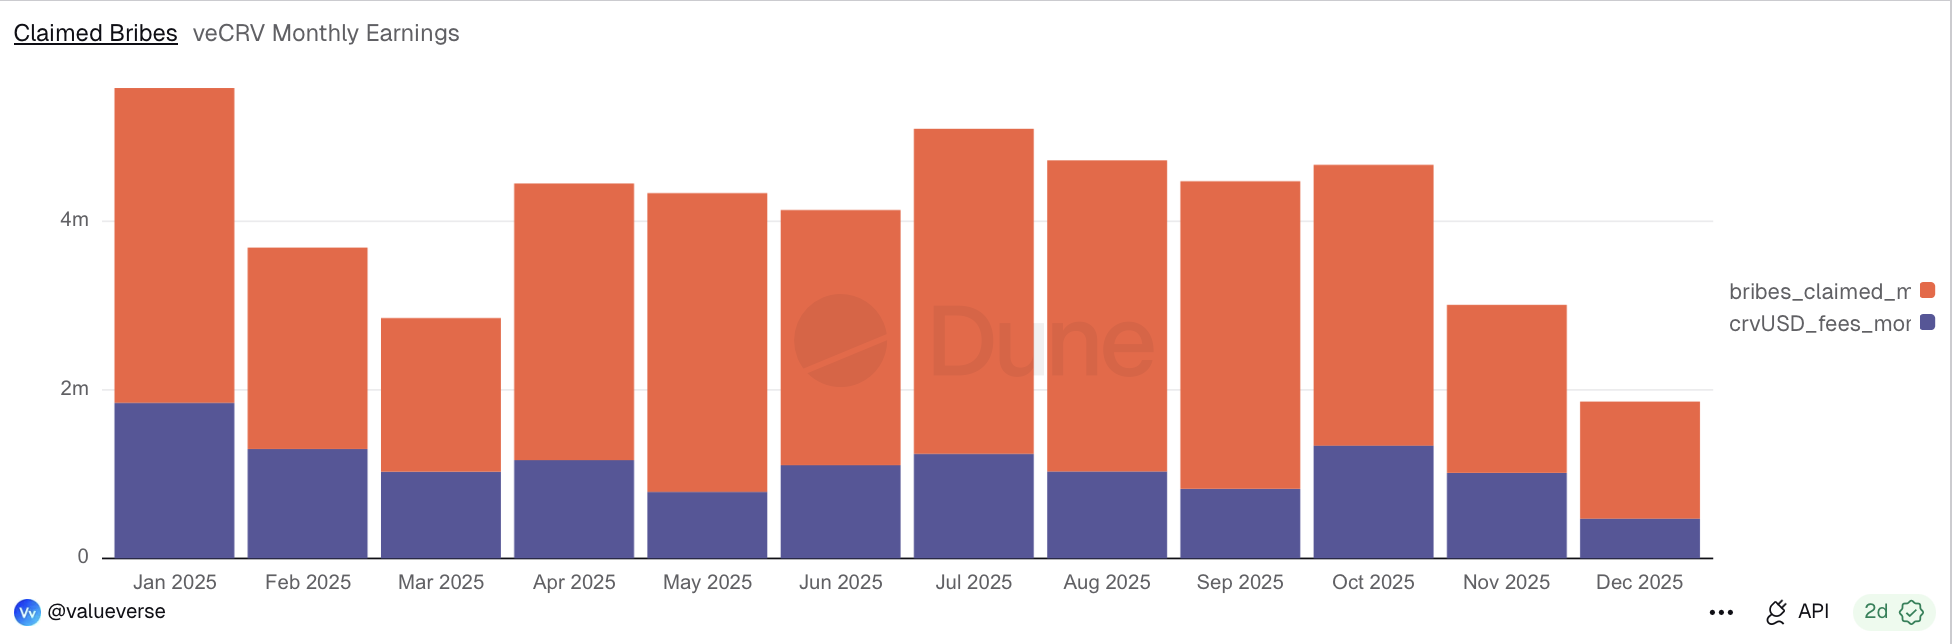
Chart featuring overall token holders revenue. Bribes and fees separately are available at https://app.valueverse.ai/tokens/curve-dao#key-metrics
$HYPE also demonstrated consistency of revenue generation in a long-term period that could be easily verified with amounts of daily buybacks. The multiplier increased from ~15 to ~17 in all periods which means revenue didn't change a lot over time.
$PUMP multipliers reveal that revenue has significantly decreased over the last three months. The 90-day multiplier is more than twice lower than the 7-day one. However, 7D 3.17 is relatively cheaper than any other asset. Such pricing clearly indicates a decline in the memecoin narrative, revenue is priced cheap (relatively to other projects).
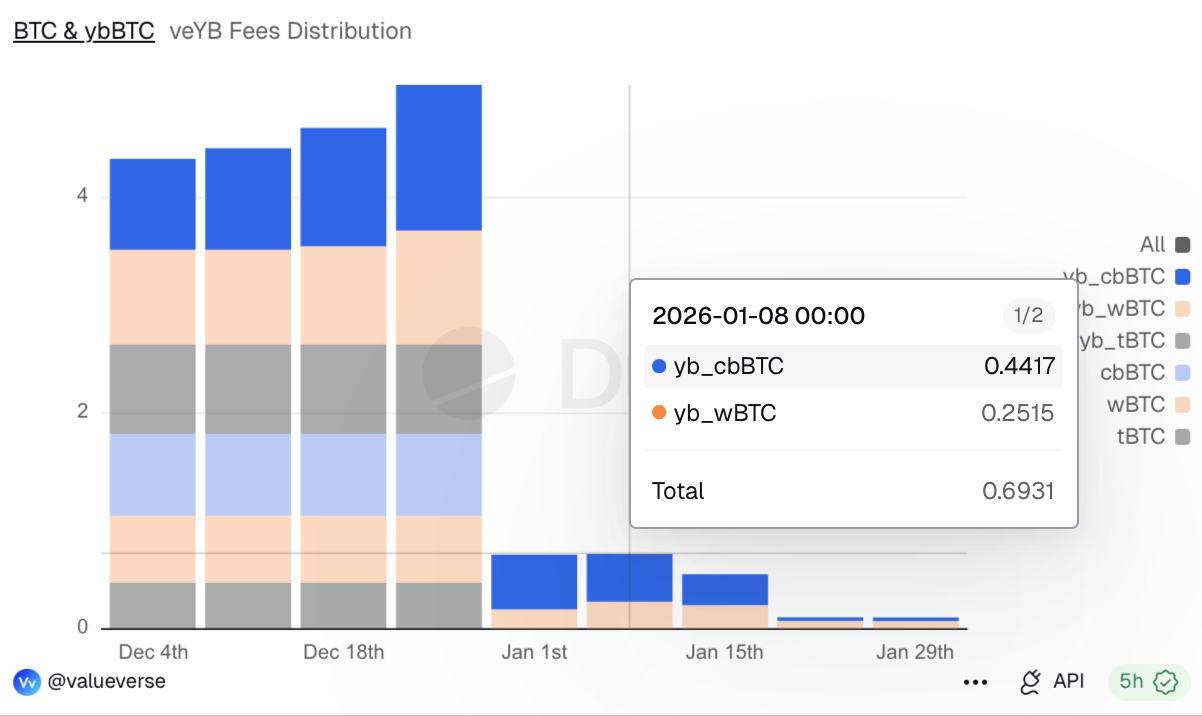
The $YB 30D is 1.61. However, the 7D is 7.9, indicating that the protocol generated much less revenue for token holders last week than last month. This is connected to the low $BTC volatility in late December. Since fees are distributed over four weeks, low volatility periods affect not only the current week or day as they do in other projects:
Complete $YB metrics: https://app.valueverse.ai/tokens/yield-basis
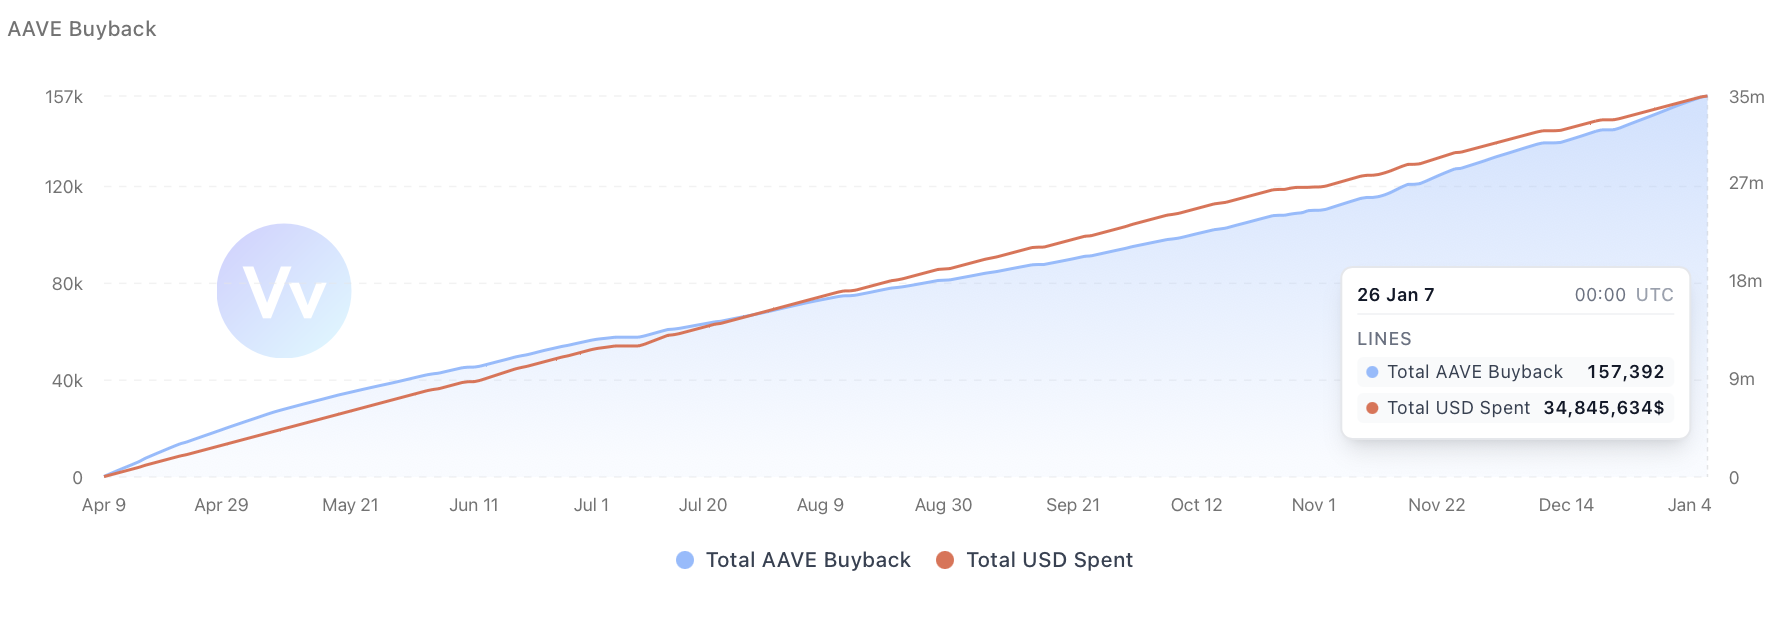
The AAVE multipliers have remained relatively consistent since April, as buybacks have been executed at similar amounts. The recent decrease in the multiplier is connected to the decrease in the price of AAVE (and therefore the value-receiving cap), despite the stable buyback amounts averaging around $35k per day.
https://app.valueverse.ai/tokens/aave#key-metrics
Let's discuss factors that could affect multipliers of given assets:
- There are two key factors for $YB: TVL expansion and market volatility. $YB directly profits from volatility. Higher trading volumes mean higher fees. Adding assets beyond $BTC, such as $WETH, diversifies veYB income. Recent $BTC movements demonstrated the protocol's ability to generate fees when volatility rises.
- For $CRV, the key factors are: bribes activities and demand for $CRV emissions distribution. The second factor is swap fees and related financial services provided by the DAO.
- For $AERO/$VELO, it is market volatility and trading activities on Base and Optimism, respectively. The average annual income for 1veAERO is $0.24, while the revenue from the most recent epoch is only $0.094. If market activity returns, revenue could bounce back.
- $PUMP definitely needs the memecoin narrative to return since it affects not only revenue itself, but also revenue estimations and pricing. According to the current 3.17 multiplier, estimations are clearly quite weak. However, it has always been in the range of 1.5–4.
- $HYPE could generate additional revenue from overall market volatility and from trading tokenized stocks on Hyperliquid once it gains traction. The team unlocks are already accounted for in our model (since they are staked, see the methodology).
- The $AAVE multiplier is mainly affected by the price of $AAVE since the amount of buybacks is stable, consistent, and capped (the recent DAO proposal is for $50 million per year).
Utility Highlights
- Just before the New Year, Uniswap ($UNI) finally implemented a long-discussed fee switch. Current data reveals $27 million in annual buybacks, implying a 133x eff_mcap/revenue ratio (using Coingecko's mcap).
- Lighter launched its buyback program this week and has been accumulating $LIT at the zero address. To date, the total amount of buybacks is 270,000 $LIT ($795,000), implying an effective market cap/revenue ratio of 5-7x, which is definitely cheaper than $HYPE.
- $POL had an outstanding first week of the year, reaching an all-time high (ATH) in revenue since late 2023. $POL is now deflationary, having burned 8.2 million POL in seven days versus 11.8 million POL in all of 2025. This is the result of Polymarket's operations and the diversification of its overall network revenue streams.
New supported assets
We recently added support for the following assets on Valueverse. Currently, only the Utility Structure is available for most of them, but data sets will follow.
- $crvUSD, tracking trading volumes, peg, and Yield Basis impact on adoption
- $POL (ex Matic), tracking $POL utility structure
- $VIRTUAL, utility structure & metrics
- $SLX & $USX, native token and yield-bearing stablecoin of Solstice
- $MEZO, newly launched BTC Economic Layer
- $WET, Humidify token structure
Feedback appreciated
As it was stated above, it is the first release focused on experimental effective m.cap/revenue metrics. We are open to feedback:
Disclaimer: This article and the accompanying analysis are provided by Valueverse for research and educational purposes only. All token valuation frameworks, metrics, comparisons, and conclusions discussed herein are experimental in nature and may rely on incomplete, estimated, delayed, or incorrect data, as well as subjective assumptions and methodologies.
The presented analyses do not represent definitive valuations, forecasts, or assessments of financial performance, and should not be interpreted as statements of intrinsic value. Digital assets and tokens are highly volatile, and their economic characteristics may change over time.
Nothing in this publication constitutes investment advice, financial advice, legal advice, or a recommendation to buy, sell, or hold any asset. Readers are solely responsible for their own research, risk assessment, and investment decisions.
Supplementary: calculation methodology
Multiplier Calculation Methodology
- effective asset m.cap divided by the annual extrapolation of revenue received by asset holders over the last N days (7D, 30D, 90D, 180D)
- The 365D metric represents revenue received over a year (historically, not an extrapolation).
- The asterisk (*) indicates that revenue-receiving data is available for less than 365 days, and the metric is an extrapolation of the longest available period.
Asset prices are recorded at the time of calculation. During the next calculation one week later, we will compare them and take price changes into account.
The methodology for effective market capitalization (Mcap) and revenue accounting for given tokens is as follows:
YB (veYB)
- Effective Market Cap: The market cap of YB locked into veYB (vote-escrowed YB tokens).
- Revenue: revenue originating from the admin fee charged in YB pools from swaps, which is distributed to veYB holders on a weekly basis (according to the 4 weeks equal distribution mechanism)
- The latest distribution event (January 1) is accounted for in the 7D metric.
CRV (veCRV)
- Effective market cap: The market cap of CRV locked into veCRV (vote-escrowed CRV tokens).
- Revenue: Revenue originating from the admin fee charged in CRV pools from swaps. This revenue is distributed to veCRV holders in $crvUSD on a weekly basis. There is also revenue from veCRV bribes.
- The latest distribution event (January 1) and claimed bribes over the past seven days are accounted for in the 7D metric.
AERO (veAERO)
- Effective market cap: The market cap of AERO locked into veAERO (vote-escrowed AERO tokens).
- Revenue: All trading fees from pools with a gauge, all bribes provided for those pools, AERO rebases, and public goods fund buybacks.
- The latest distribution event (January 1) is accounted for in the seven-day metric.
VELO (veVELO)
The calculation methodology is almost the same as for AERO, with one difference: there are no buybacks from the Public Goods Fund.
PUMP
- Effective market cap: All $PUMP in circulation since buybacks indirectly benefits all existing token holders.
- The tricky question is the precise "supply in circulation" metric, since it differs on different platforms. The Pump.fun website's token section states 1T, which is the FDV supply. We use 590 billion $PUMP, as reported by the team to CMC and listed on Coingecko.
- Revenue: All platform fees are used for buybacks (daily tracking).
HYPE
- Effective Market Cap: Since the buybacks, all $HYPE in circulation benefits all existing token holders.
- For circulating market cap accounting, we use the total supply from CoinGecko and subtract future emissions from that number. Since unvested team tokens are staked, we include them in the circulating supply and consider how buybacks affect their value.
- Revenue: All platform fees are used for buybacks (daily tracking) and to burn HypeCore and HypeEVM $HYPE.
AAVE
- Effective market cap: All $AAVE in circulation since the buybacks indirectly benefits all existing token holders
- Revenue: buybacks (daily tracking) and $stkAAVE rewards cashflow