Value State 003: Valuing Cashflow Without Narratives
While the market is uncertain and major alts are close to the cycle lows, it’s a perfect time to evaluate the revenue pricing of Revenue Meta projects.
TL;DR
- Buyback revenue is generally more expensive than direct fee sharing (except $PUMP)
- Owning $1 of tokens in $CRV, $AERO, $PENDLE, or $YB earns up to 3-7x yield vs. average buybacks
- The $UNI revenue is 28 times more expensive than $CRV and 74 times more expensive than $AERO.
In this research, we provide a revenue pricing analysis through the lens of Effective Revenue Multipliers applied to the selected set of tokens.
Revenue pricing overview
The table below shows how multipliers reflect the cashflow received by token holders in recent periods, accordingly to current market price (overall & per source).
Table: Effective Revenue Multipliers for Revenue Meta tokens.
| Asset | Revenue-receiving (effective) mcap, USD | 7D | 30D | 90D | 180D | Annual average |
|---|---|---|---|---|---|---|
| CRV | 299,467,485 veCRV only (fees+bribes) | 4.35 | 9.24 | 8.51 | 6.64 | 6.41 |
| admin fee | 45.74 | 62.96 | 35.89 | 26.82 | 24.88 | |
| bribes | 4.8 | 10.83 | 11.16 | 8.82 | 8.64 | |
| YB | 15,240,297 veYB only (fees) | 10.88 | 6.07 | N/A | N/A | 1.33* |
| AERO | 437,495,471 veAERO only (fees+bribes+rebase+buyback) | 3.87 | 4.57 | 3.53 | 2.65 | 2.41 |
| fees+bribes+rebase | 4.09 | 4.95 | 3.77 | 2.73 | 2.52 | |
| claimable cashflow (fees+bribes) | 4.52 | 5.54 | 4.14 | 2.95 | 2.77 | |
| 822,844,465 buybacks (all AERO supply) | 72.72 | 59.41 | 55.02 | 94.03 | 57.93 | |
| VELO | 25,478,165 veVELO only (fees+bribes+rebase) | 6.56 | 6.69 | 5.34 | 4.17 | 3.03 |
| PUMP | 1,488,625,222 PUMP supply, buybacks | 2.85 | 2.82 | 3.73 | 4.22 | 4.31* |
| HYPE | 9,694,288,379 | 14.77 | 17.02 | 16.88 | 15.79 | 15.37* |
| AAVE | 381,582,221 AAVE Safety Module staking+buybacks | 18.47 | 17.51 | 18.55 | 19.46 | 17.43* |
| 2,421,984,000 buybacks only | 88.96 | 57.16 | 64.34 | 76.32 | 75.24* | |
| 381,582,221 AAVE Safety Module staking revenue | 23.31 | 25.25 | 26.06 | 26.11 | 22.68* |
Other revenue meta tokens:
- $PENDLE 2.76 7D, 3.77 365D
- $UNI: 133x 7D, 179x 365D*
Meaning:
- 7-180D multiplier reflects annualization of recent revenue distribution period
- 365D multiplier reflects historical revenue during past year to date
- * Reflects the yearly average, calculated using annualization for the longest available revenue period (for projects with a revenue period of less than 365 days)
Multiplier indicates the assessment price of $1 of revenue in the future year period (under the simple linear annualisation).
Disclaimer: The effective market cap / revenue metrics shown are experimental and illustrative, may be inaccurate, and are provided for educational purposes only. This is not investment advice.
Cashflow Composition & Pricing Exploration
Curve.Finance ($CRV)
$CRV receives two sources of revenue being locked in veCRV:
- Admin fee, unconditionally
- Bribes, requires voting (average bribe income accounted)
The recent epoch was quite successful for Curve, resulted in generating x2 fees from late Dec lows and ATH in bribes since Aug 2025:
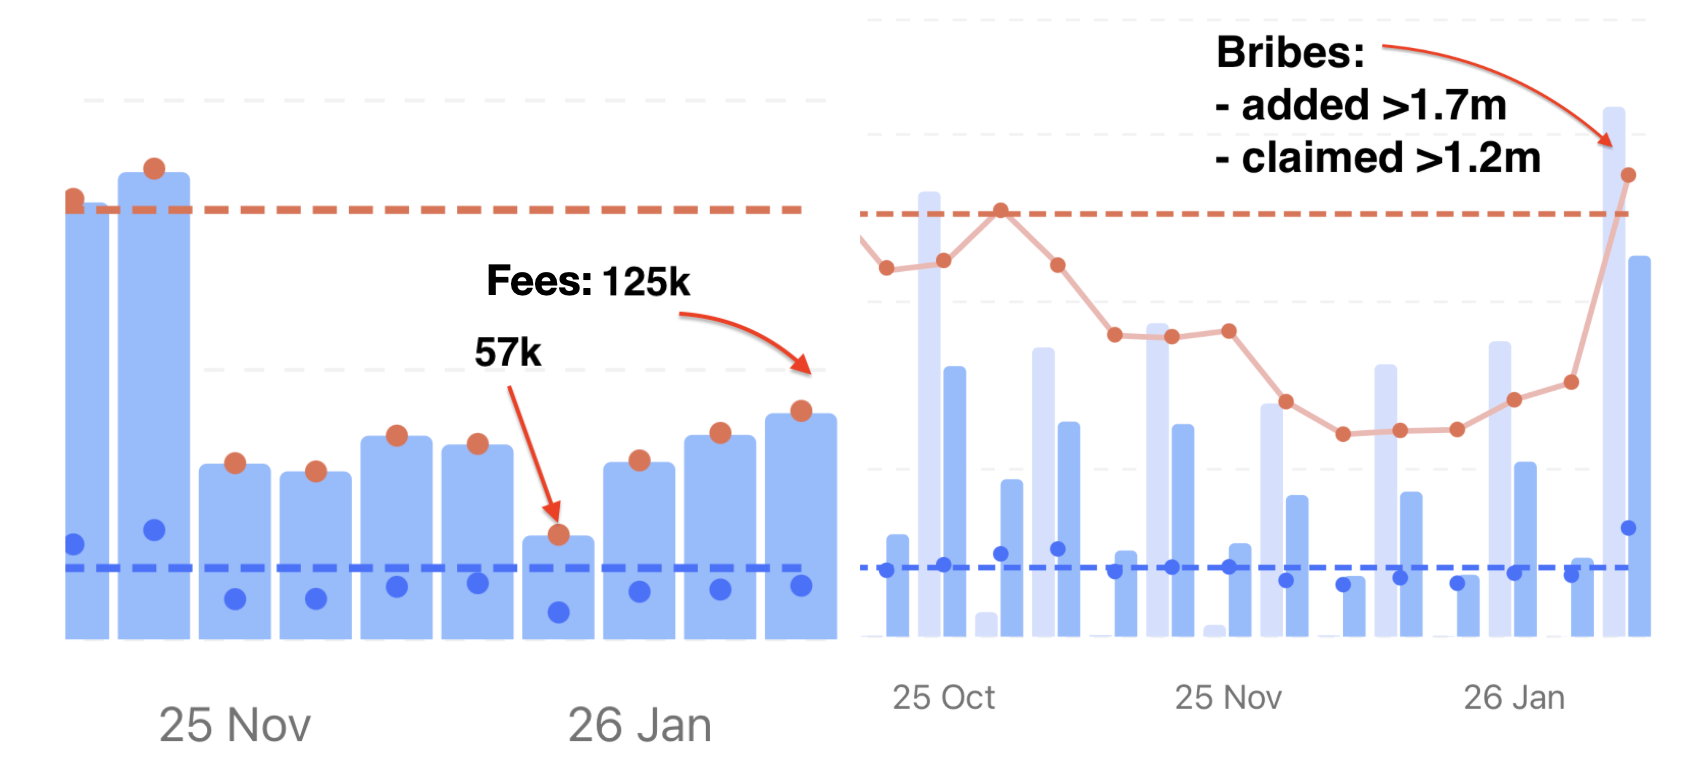
The major share of yield available for $veCRV holders comes from governance proceeds (bribes). The recent bribes 7D multiplier is 4.8x while fees ~45x.
The cumulative 7D one, assuming veCRV holder receives fees+bribe income is 4.35x; with annual average of ~6.4x.
Yield Basis ($YB)
The Yield Basis token locked in veYB provides its holders with fees and technically available bribes.
However, since bribes have not yet been provided, $veYB currently only generates income from fees.
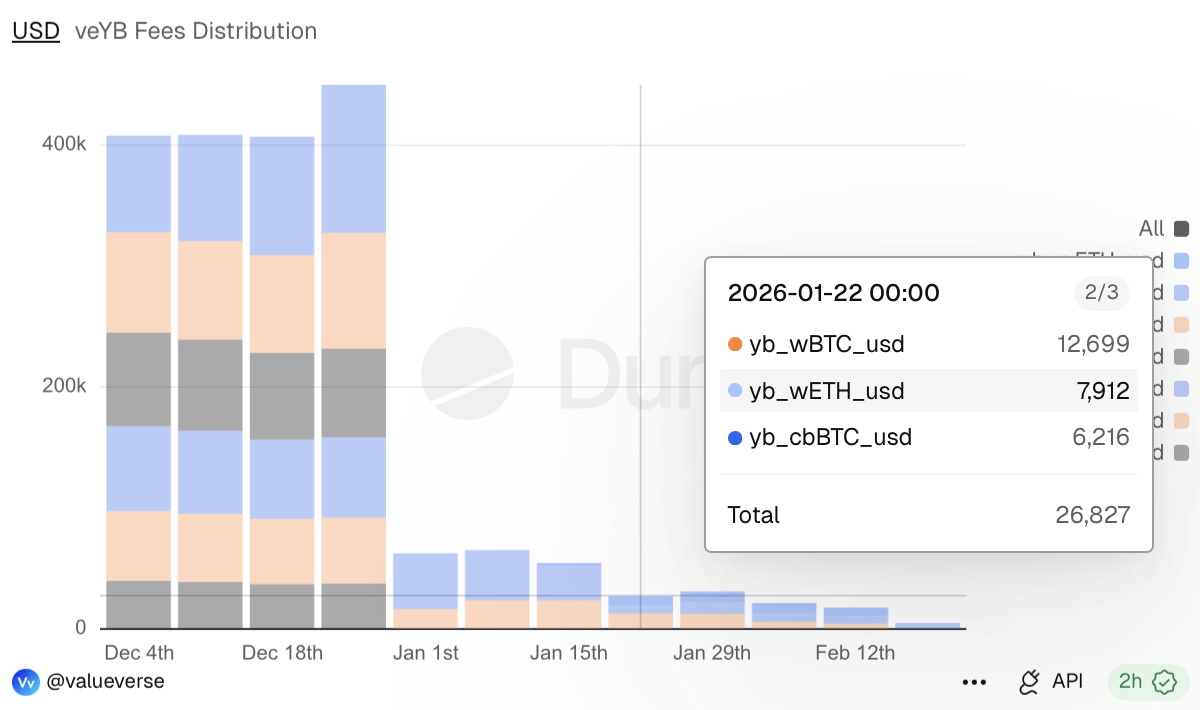
The 7D multiplier reflects the decline in revenue during the recent period of low volatility (compared to November and December of 2025), while the 30D multiplier reflects the higher revenue during the past three epochs (from January 1st to January 15th).
Since the fee switch, the annualized revenue for 365D* shows a 1.33x multiplier, or ~$0.187/veYB/year. This accounts for a theoretical scenario in which substantial volatility returns following the fee distribution from December 4, 2025, to January 22, 2026, throughout the entire year.
Aerodrome ($AERO)
Aerodrome has four sources of revenue for AERO:
- Rebasing and offsetting emission dilution are unconditionally provided to veAERO lockers.
- Fees generated by AMM pools are provided to veAERO voters for the corresponding pools.
- Bribes are provided to veAERO voters for the corresponding pools.
- Buybacks indirectly affect all AERO holders, not only veAERO.
We accounted for veAERO proceeds separately (fees, bribes, rebase, and buybacks), veAERO proceeds outside of buybacks, veAERO claimable cashflow (fees and bribes), and buybacks.
The multipliers clearly reveal that the claimable yield (fees + bribes) accounts for the majority of the cash flow available to token holders.
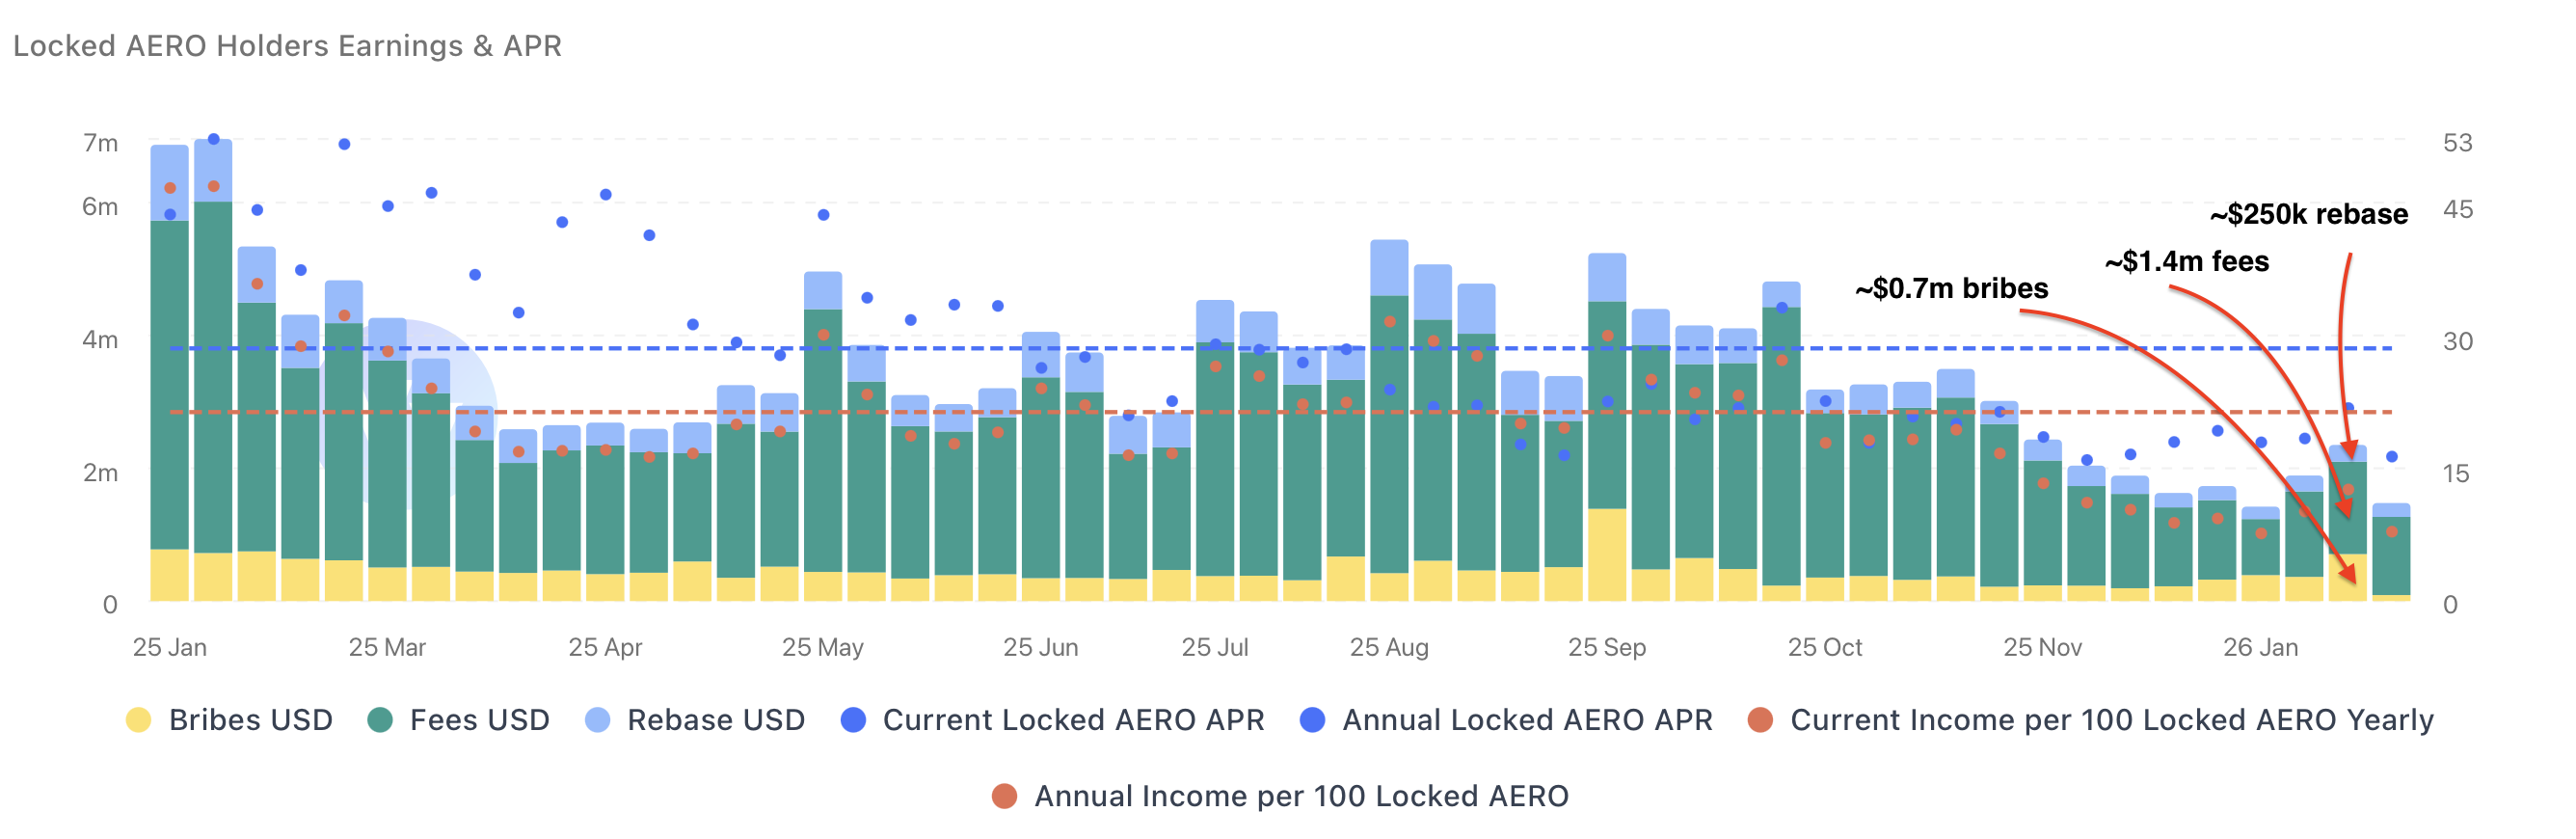
Since the beginning of 2024, the Public Goods Fund has only bought back $26.5 million of AERO, while veAERO holders have earned an annualized income of ~$184 million to date:
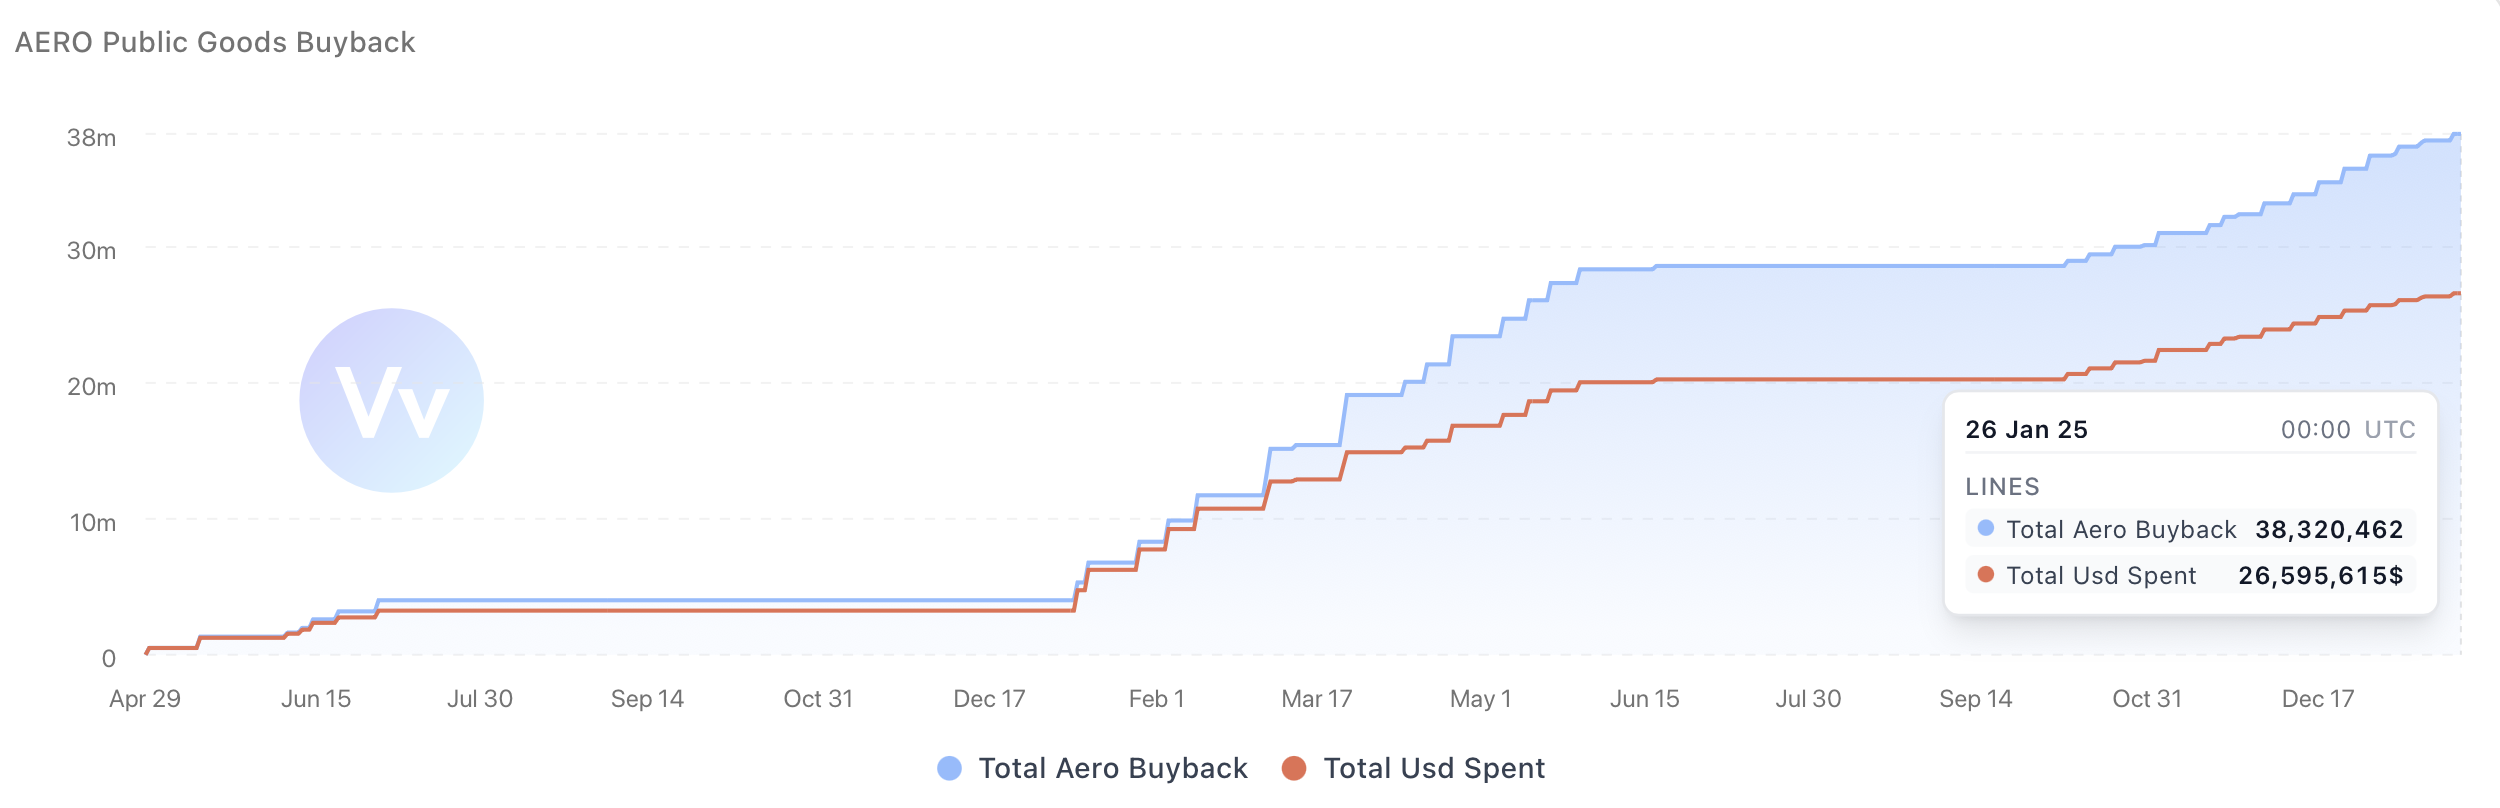
The recent total 7D revenue pricing is 3.87x, from which the claimable cash flow is 4.52x, with an annual average of 2.41x. Note that the 7D and annual accounts include all cash flow sources, including buybacks.
Velodrome ($VELO)
Velodrome has the same revenue structure as AERO with an exception for buybacks.
$VELO has a weaker revenue profile vs. $AERO, ~6.5x 7D and ~3x annual historical multiplier.
Pump.fun ($PUMP)
Pump.fun has only one revenue source - buybacks, affecting the entire holders’ m.cap.
Pump.fun spent huge amounts for buyback resulting in ~20.73% of supply reduction (1.26 supply reduction index, reflecting relative value growth for token holders since ICO):
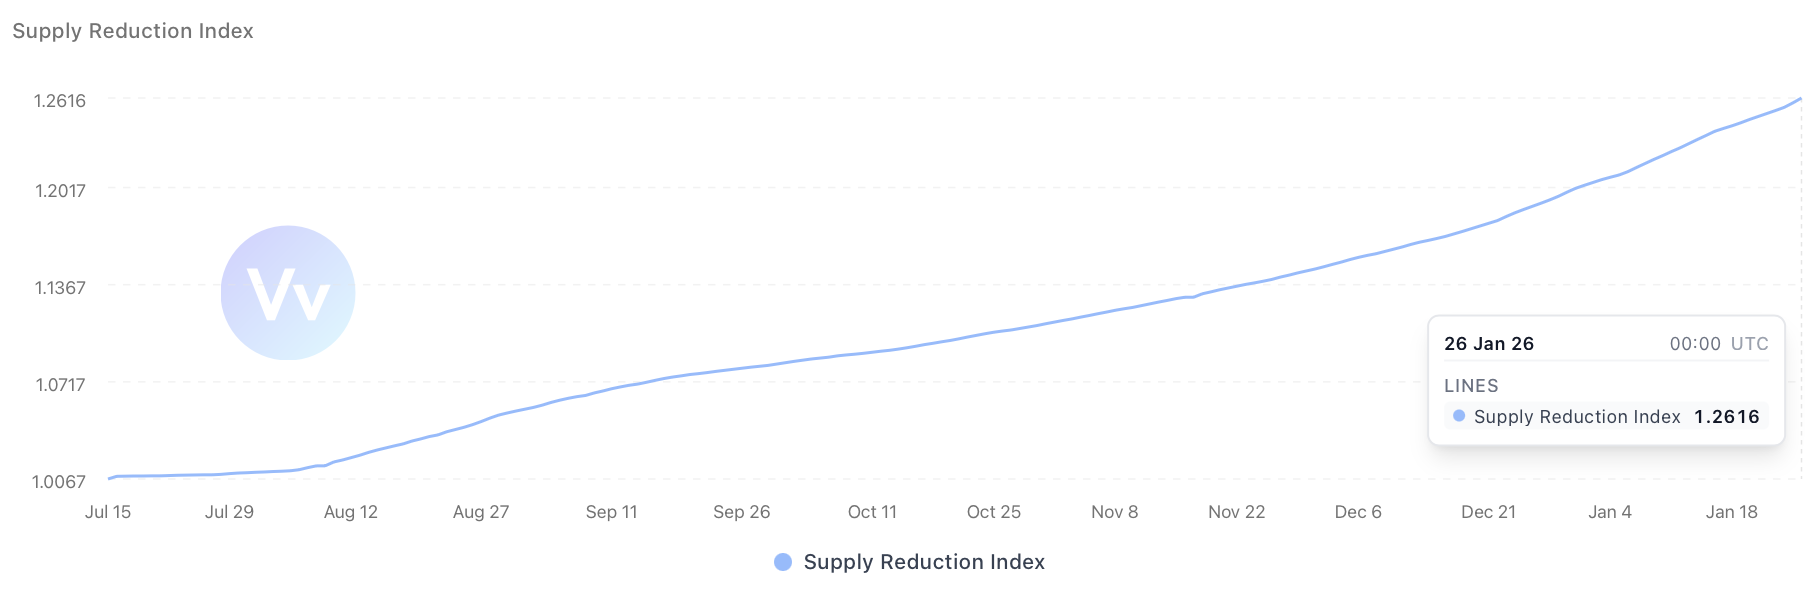
However, it is still traded significantly below ICO price with quite low multipliers - 2.85 7D, 4.31 365D*.
Hyperliquid ($HYPE)
For $HYPE, we track four sources of revenue: buybacks, HYPE staking, HypeEVM, and HypeCORE $HYPE burn. However, buybacks account for the majority of revenue for token holders (~$726 million spent since March 20, 2025).
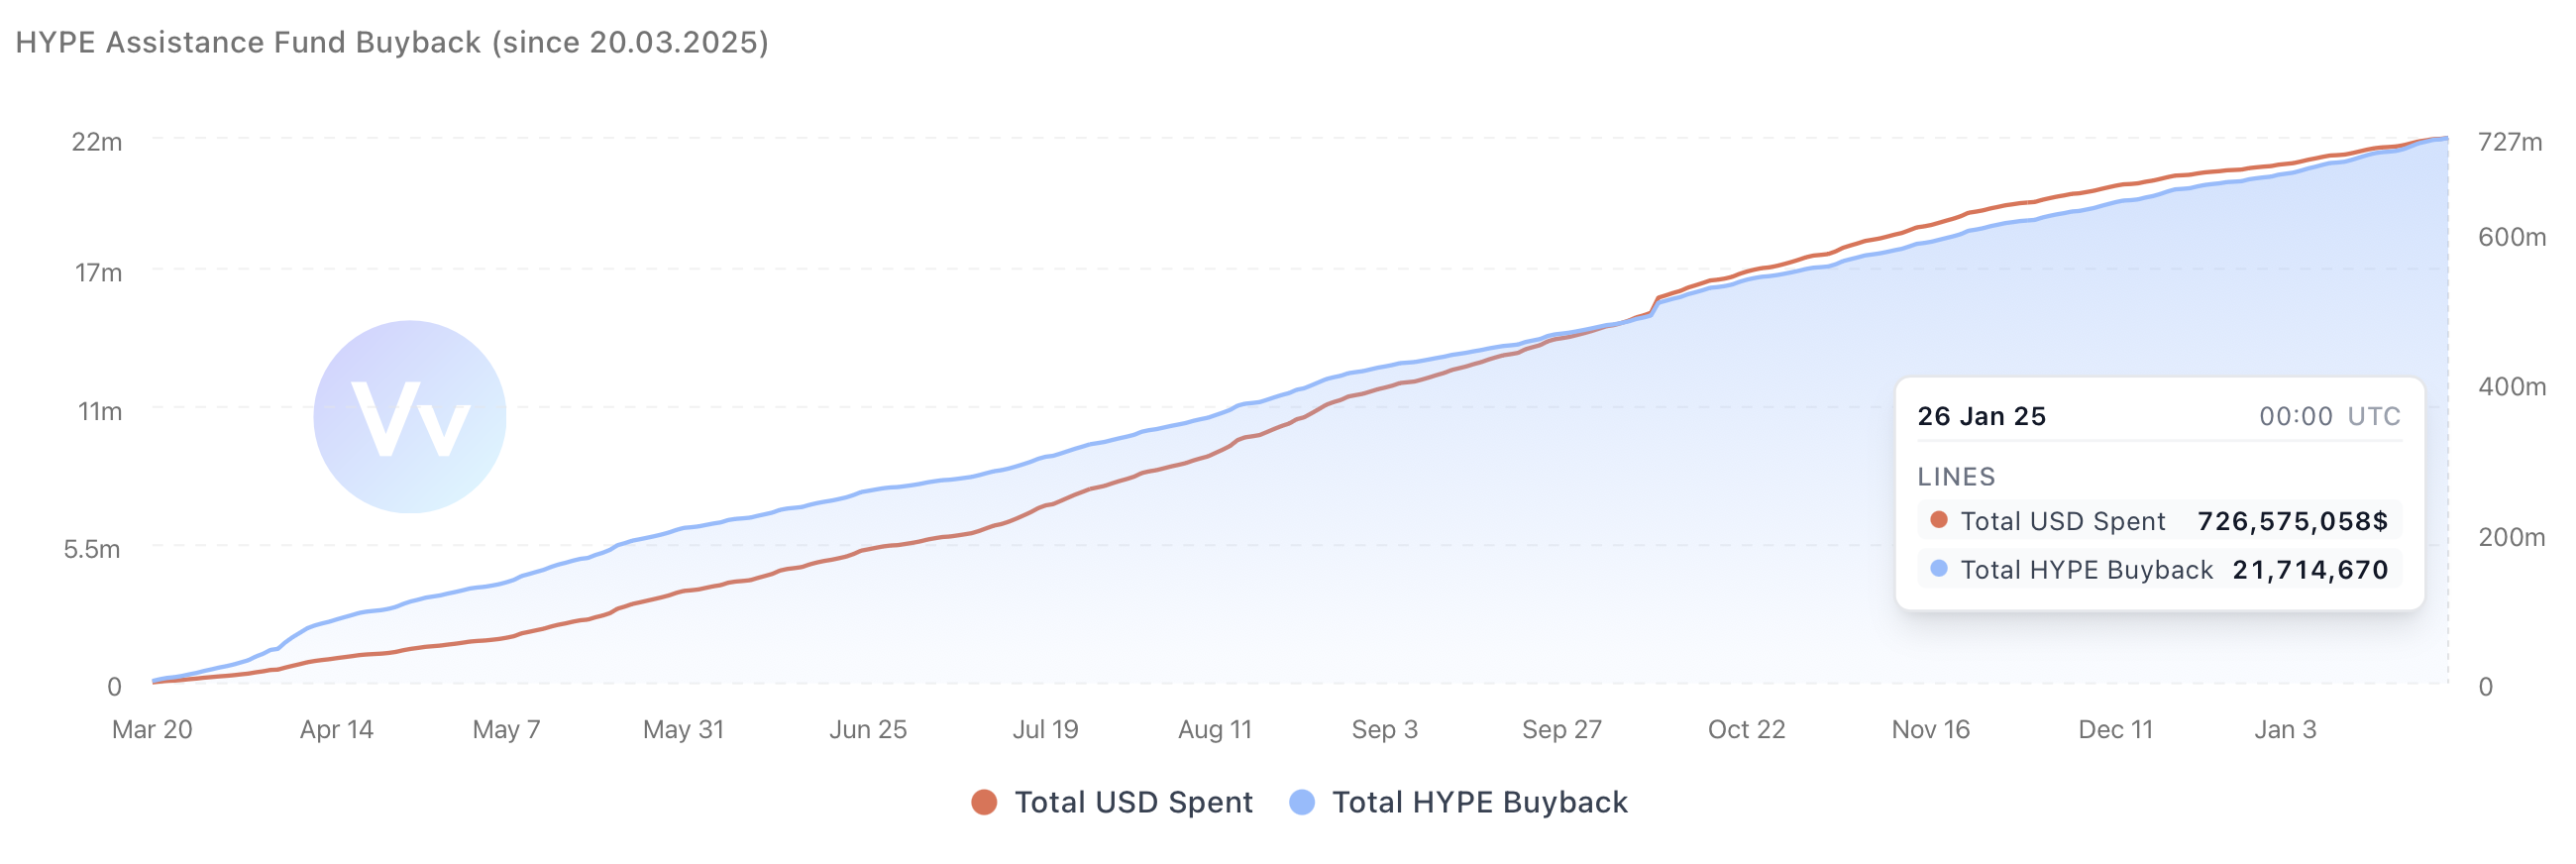
Other sources of revenue have a much smaller impact on the value of $HYPE.
The multipliers are provided for $HYPE holders who receive staking yield from the validator and for all supply reduction, which occurs indirectly. Compared to AMM DEXes (e.g., $CRV and $AERO), $HYPE trades at a valuation that is 3-4 times higher than that of the aforementioned projects (~14-16x multiplier in various periods).
AAVE ($AAVE)
$AAVE has two revenue sources: buybacks and staking in the AAVE Safety Module, the latter of which is becoming a legacy token function and will be replaced by another solution.
However, we must account for this source, as 2.5 million $AAVE (15.65%) remains in the Safety Module, earning 3.79% of stkAAVE revenue.
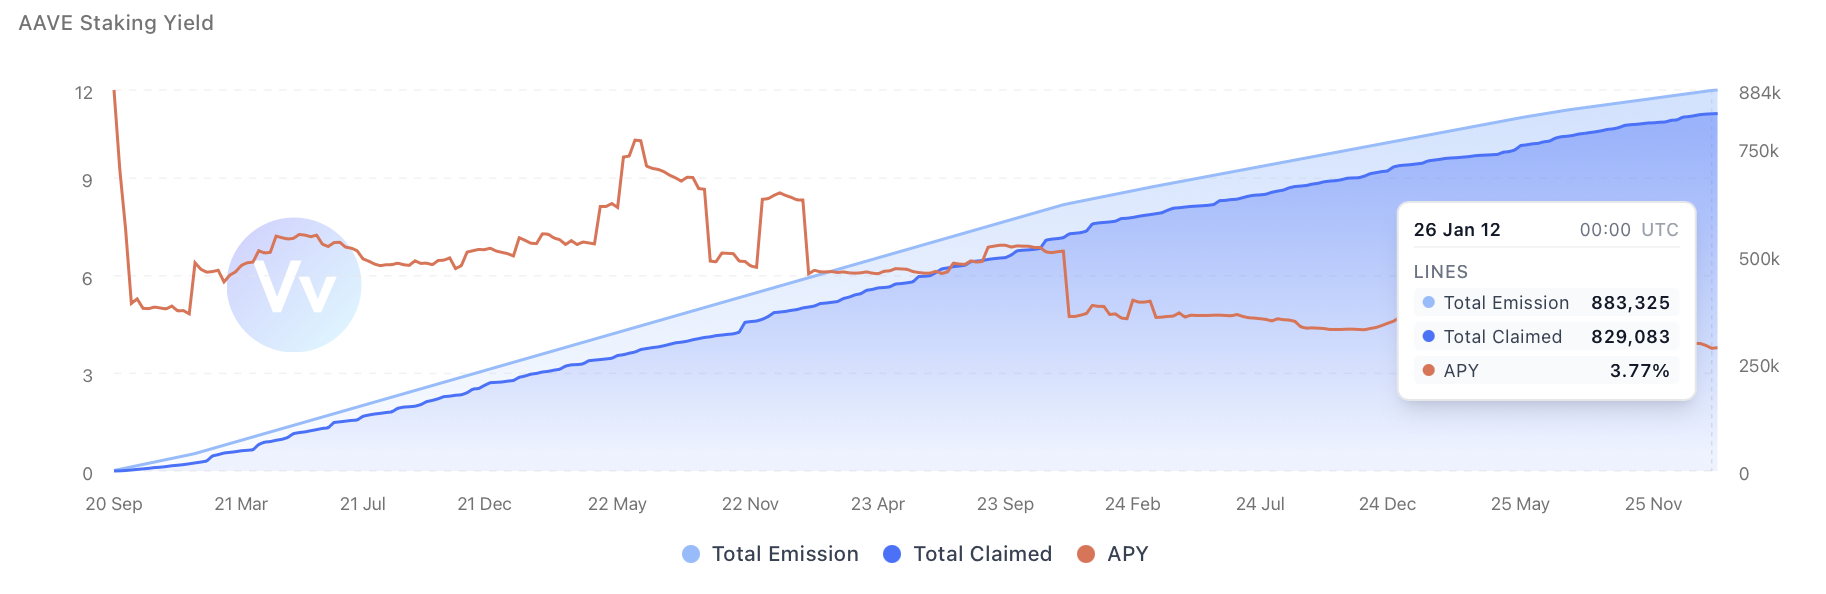
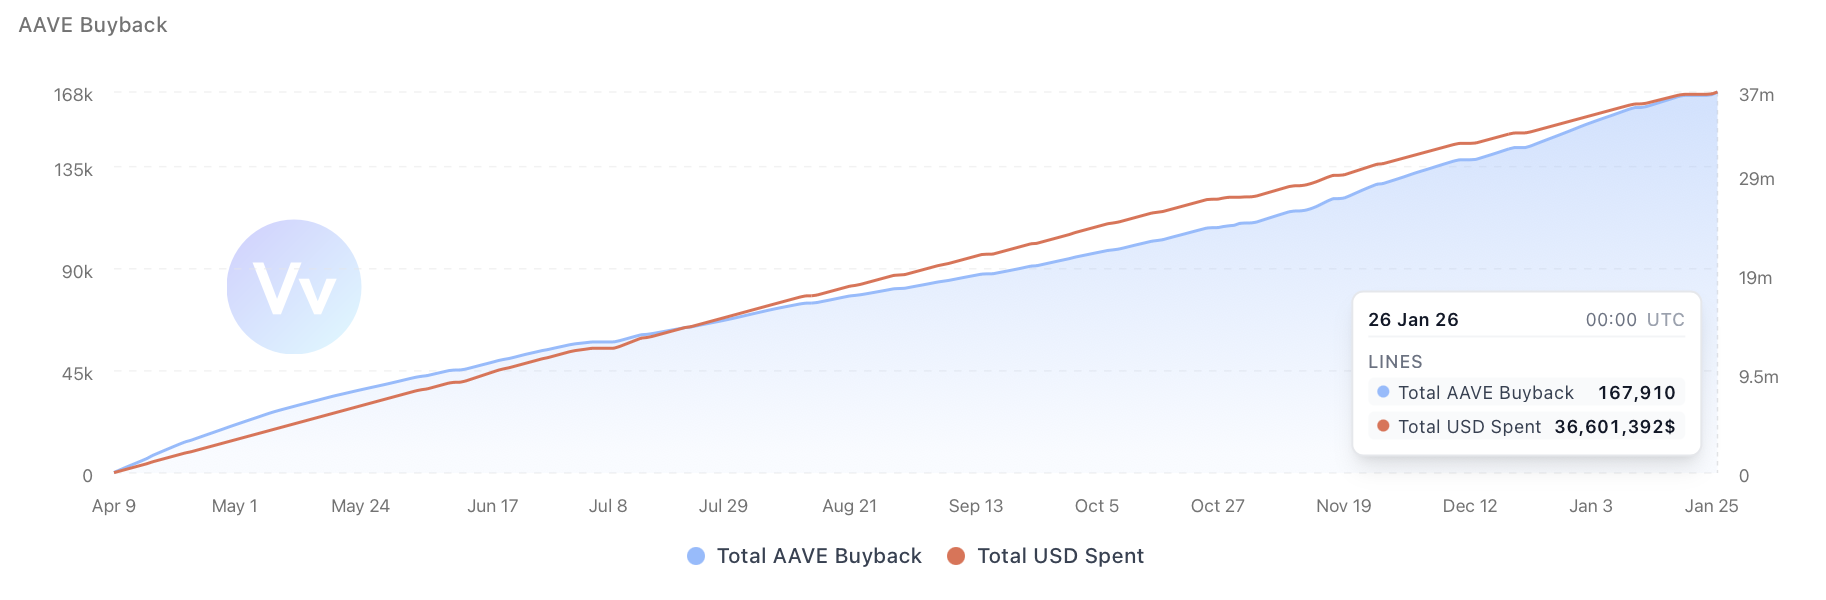
Buybacks, which are commonly recognized as the most important source of revenue for $AAVE, affect all token holders but have much less influence on token value and revenue multipliers.
The amount spent on $AAVE buybacks is approximately $36.6 million, resulting in 1.05% of the supply being bought back (compare this with the 15% of the supply earning 3.77% APY).
Of course, $stkAAVE earns revenue from emissions. However, for token holders, it is a more tangible and substantial source of revenue.
All of this is reflected in the revenue multipliers:
- Buybacks have an 88x 7D multiplier, while stkAAVE has a 23x 7D multiplier.
- The overall 7D multiplier is 18.47, which accounts for the most valuable option for token holders—staking in stkAAVE (+ automatically receiving buybacks, affecting all token holders).
Without stkAAVE, the annual multiplier for would be ~75x, which is roughly 5x times more expensive than $HYPE.
$PENDLE & $UNI
Pendle has a revenue distribution model for token holders that is now transitioning to a new model. We are tracking the current results: 3.77x 365D, is a top performing result in DeFi alongside with other ve models.
However, Uniswap buybacks are quite small compared to its market cap, as reflected in 133x 7D and 179x 365D*, meaning it is the most expensive token in our observations.
It means that $UNI is 28x more expensive (in terms of revenue pricing) than $CRV and 74x more expensive than $AERO.
What can we learn from Effective Multipliers tracking
The Revenue Meta has two types of tokens: direct fee-sharing and buyback.
Buyback valuations are always higher than direct fee-sharing ones, except for $PUMP:
- This means that token holders receive much less revenue for every $1 of revenue-eligible supply.
- Notably, they receive only an "indirect revenue share" in terms of supply decrements, with no tangible, claimable yield.
- Despite spending hundreds of millions on buybacks and offsetting over 20% of the supply, $PUMP is still trading much less than the ICO price, with a 2-4x multiplier in various periods.
Even for AAVE, the staking yield has the most significant impact on the value received by token holders. Without it, the AAVE multiplier would be ~75x. However, Uniswap buybacks drive the valuation up to ~179x annually.
In contrast, direct revenue-sharing tokens, such as $CRV, $YB, and $AERO, have much lower multipliers and provide a claimable yield for token holders.
What if the next stage of Revenue Meta will be driven by direct fee share models?
Feedback appreciated
It is an experimental research focused on efficient m.cap/revenue metrics.
We are open to feedback in Twitter DMs.
Disclaimer: This article and the accompanying analysis are provided by Valueverse for research and educational purposes only. All token valuation frameworks, metrics, comparisons, and conclusions discussed herein are experimental in nature and may rely on incomplete, estimated, delayed, or incorrect data, as well as subjective assumptions and methodologies.
The presented analyses do not represent definitive valuations, forecasts, or assessments of financial performance, and should not be interpreted as statements of intrinsic value. Digital assets and tokens are highly volatile, and their economic characteristics may change over time.
Nothing in this publication constitutes investment advice, financial advice, legal advice, or a recommendation to buy, sell, or hold any asset. Readers are solely responsible for their own research, risk assessment, and investment decisions.