
Value State 004: Revenue from Volatility
During downtrends and market uncertainty fundamentals matter more than ever. In this report we explore how projects generate cashflow streams for token holders during the extreme volatility.
TL;DR
- veTokenomics DEXes such as $CRV, $YB, $AERO, $VELO efficiently capture revenue from volatility, distributing boosted yields to veHolders (up to 6.7x growth in case of $YB), while prices decreased, resulting in a 2-10x decrease in revenue pricing.
- Owning $HYPE also pays well since the market efficiently prices revenue from volatility (+17.3% price, +87% weekly fees).
- Buybacks of $AAVE and $UNI have increased while their prices have decreased. $PUMP is an outsider, as its revenue and token price have declined.
In this research, we provide an overview of how tracked projects generate revenue from volatility and their market valuation: cashflows distributed to token holders and market pricing (Effective Revenue Multipliers right now).
Revenue pricing overview
The majority of tokens on this market are in a huge downtrend and testing new lows every day ($HYPE is the only exemption). However, some of them continuously generate substantial revenue that multiplied during recent volatility periods, while market prices this much cheaper than before.
Table: Revenue & its pricing during market crash vs. pre-crash week.
| Asset | Effective mcap, USD | Price change | 7D Multiplier change | 7D | 30D | 90D | 180D | Annual average |
|---|---|---|---|---|---|---|---|---|
| CRV | 225.7m veCRV only (fees+bribes) | -25% | 2.27x | 1.92 (-55.9%) | 3.46 (-62.6%) | 5.41 (-36.4%) | 4.65 (-30%) | 4.66 (-27.3%) |
| admin fee | x5 | 9.14 (-80%) | 17.71 (-71.9%) | 22.15 (-38.3%) | 19.66 (-26.7%) | 18.26 (-26.6%) | ||
| bribes | 1.97x | 2.44 (-49.2%) | 4.31 (-60.2%) | 7.15 (-35.9%) | 6.09 (-31%) | 6.26 (-27.5%) | ||
| YB | 10.87m veYB only (fees) | -44% | 10.8x | 1.01 (-90.8%) | 2.56 (-57.8%) | N/A | N/A | 0.99* (-25.6%) |
| AERO | 333.4m veAERO only (fees+bribes+rebase+buyback) | -24% | 2.04x | 1.9 (-50.9%) | 2.88 (-37%) | 2.76 (-21.8%) | 2.07 (-21.9%) | 1.93 (-19.9%) |
| fees+bribes+rebase | 2.06x | 1.99 (-51.3%) | 3.02 (-39%) | 2.90 (-23.1%) | 2.12 (-22.3%) | 1.99 (-21%) | ||
| 627.8m buybacks (all AERO supply) | 1.77x | 41.19 (-43.4%) | 62.29 | 56.31 | 86.81 | 62.65 (+8.1%) | ||
| VELO | 20m veVELO only (fees+bribes+rebase) | -23% | 2x | 3.26 (-50.3%) | 4.33 (-35.3%) | 4.14 (-22.5%) | 3.38 (-18.9%) | 2.48 (-18.2%) |
| PUMP | 1,488,625,222 PUMP supply, buybacks | -33.8% | 1.14x | 2.50 (-12.3%) | 2.68 | 3.44 | 3.92 | 4.17* |
| HYPE | $32.4B buybacks & burns, $14.6B staking | +17.3% | 17.27 | 20 | 21.75 | 21.03 | 20.53 | |
| AAVE | $302.1m AAVE Safety Module staking+buybacks | -23% | 1.14x | 12.79 (-30.8%) | 16.37 | 17.62 | 19.06 | 17.33* |
| $1.9B buybacks only | 3.13x | 28.38 (-68.1%) | 46.68 (-18.3%) | 54.55 (-15.2%) | 70.10 (-8.2%) | 71.69* | ||
| $302.1m AAVE Safety Module staking revenue | 23.28 | 25.22 | 26.03 | 26.17 | 22.86* | |||
| UNI | $3.31B | -20.5% | 2.68x | 49.71 (-62.6%) | 105.62 n/a | 122.97* (-31.3%) |
Details:
- Multiplier indicates the assessment price of $1 of revenue in the future year period based on past period revenue annualized (7D-365D periods).
- 7D multiplier change (x) means: how much has the cashflow received by a token holder decreased in price over the last 7 days?
Disclaimer: The effective market cap / revenue metrics shown are experimental and illustrative, may be inaccurate, and are provided for educational purposes only. This is not investment advice.
Revenue from volatility: details
Curve.Finance ($CRV)
Curve.finance made a record revenue in this week both in fees and bribes:
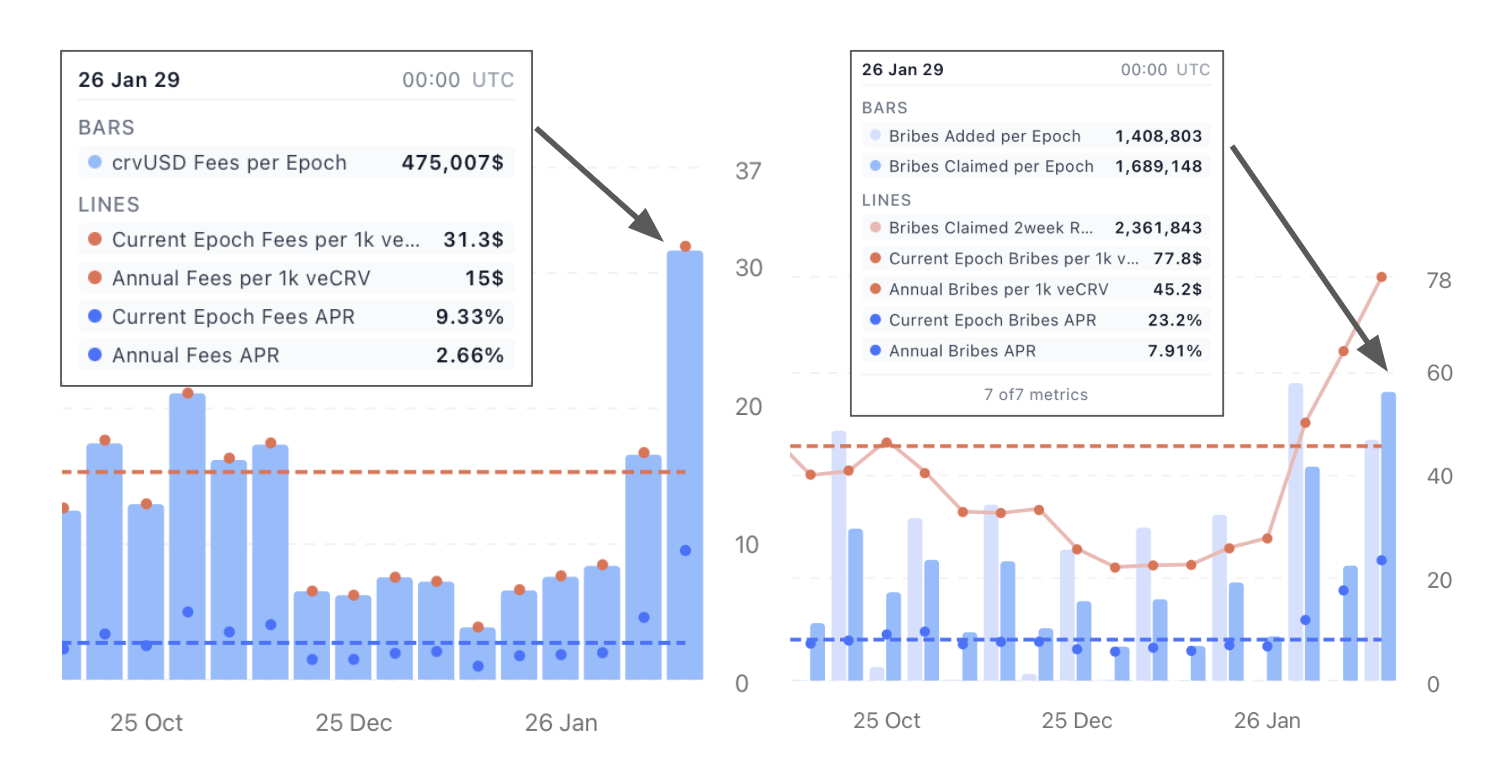
In terms of fees, this is the second-highest result of the year.
The all-time high (ATH) was on July 25 at $567k. This reflects the high demand for exchanging stablecoins and other assets during an extremely volatile week. The bribes reflect demand for Curve governance, which allocates CRV incentives to strengthen liquidity in select pools.
Weekly Result: Price -25%, Fees +92%, 7D Multiplier decrement 2.27x (the bigger amount of yield is 2.27x cheaper now). Bribes claims +56% (accounted as two weeks rolling due to distribution mechanics).
Yield Basis ($YB):
Yield Basis generated outstanding (vs. its m.cap) $0.794M fees during this week. This protocol captures fees that significantly multiply in extreme volatility periods.
However, these fees are distributed across the next four epochs so veYB holders got access only to the first distribution:
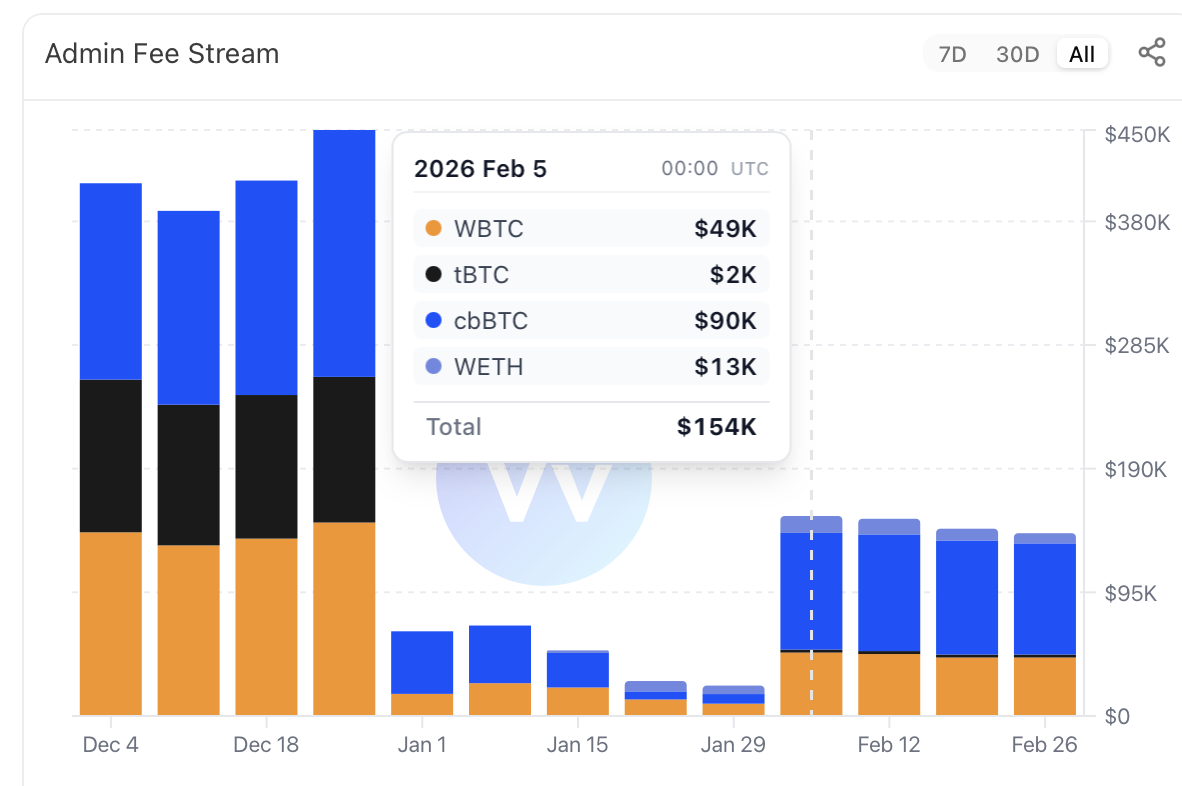
Note, that fees value changes over time due to redemption value in YB pool (fees are collected in LP positions of BTC and ETH pools).
Volatility Result: Price -44%, Fees (recent epoch only) 6.7x, Multiplier decrement 10.8x (means that yield is 10.8x time cheaper since yield multiplier and price decreased by 44%).
Aerodrome ($AERO):
As the #1 DEX on Base, Aerodrome captures significant trading volumes and fees, which it distributes to veAERO token holders. However, the full amount of revenue captured during the recent volatility isn't reflected in the current metrics since the bribes haven't arrived yet:
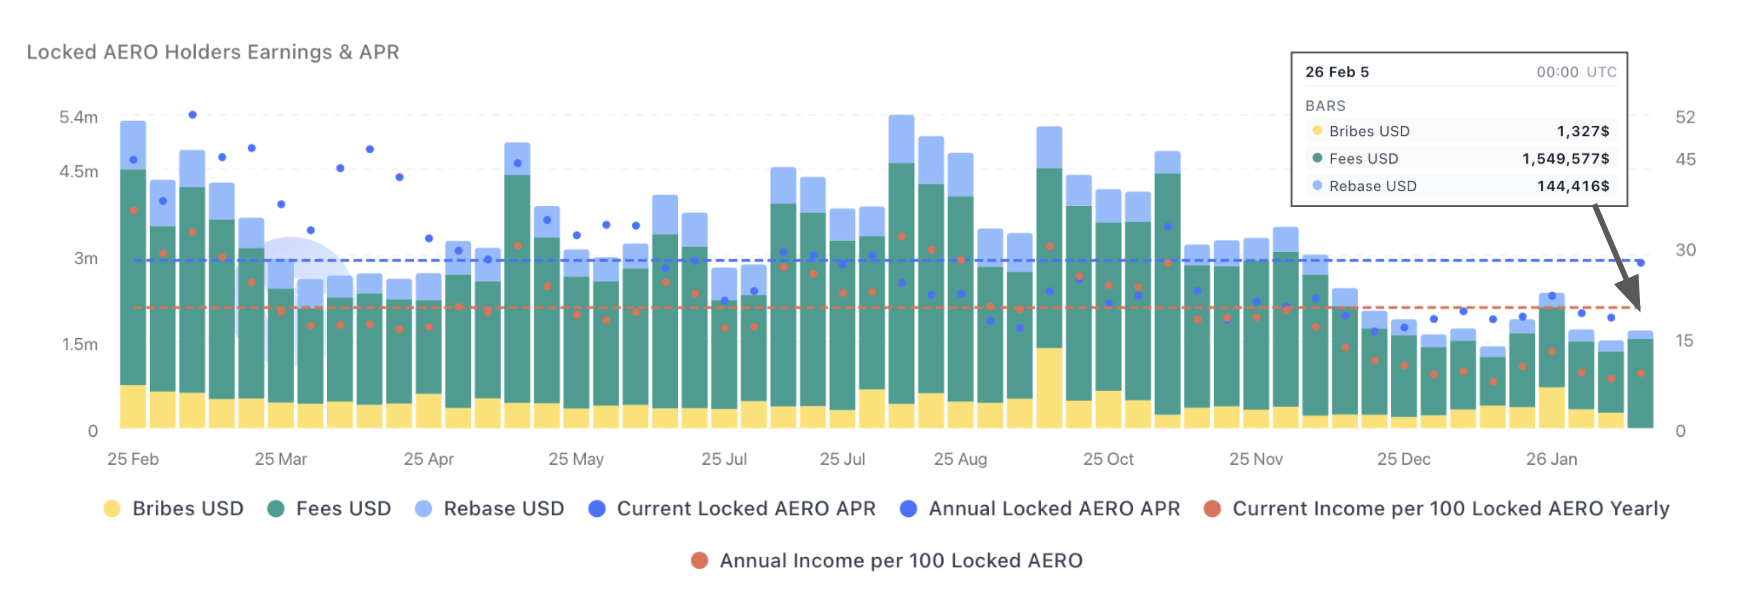
However, even with available data Aerodrome metrics demonstrated significant growth this week. The multipliers for all periods decreased, reflecting the fact that revenue approximated using any given period became cheaper.
Weekly Result: Price -24%, Fees +46%, 7D Multiplier decrement 2.04x. Bribes aren't accounted for (no data yet).
Velodrome ($VELO):
During this week, $VELO revenue significantly grew and multipliers decreased in all periods.
Weekly Result: Price -23%, Fees +34%, 7D Multiplier decrement 2x. Bribes aren't accounted for (no data yet).
Pump.fun ($PUMP):
During the week, $PUMP spent 76k $SOL for buybacks:
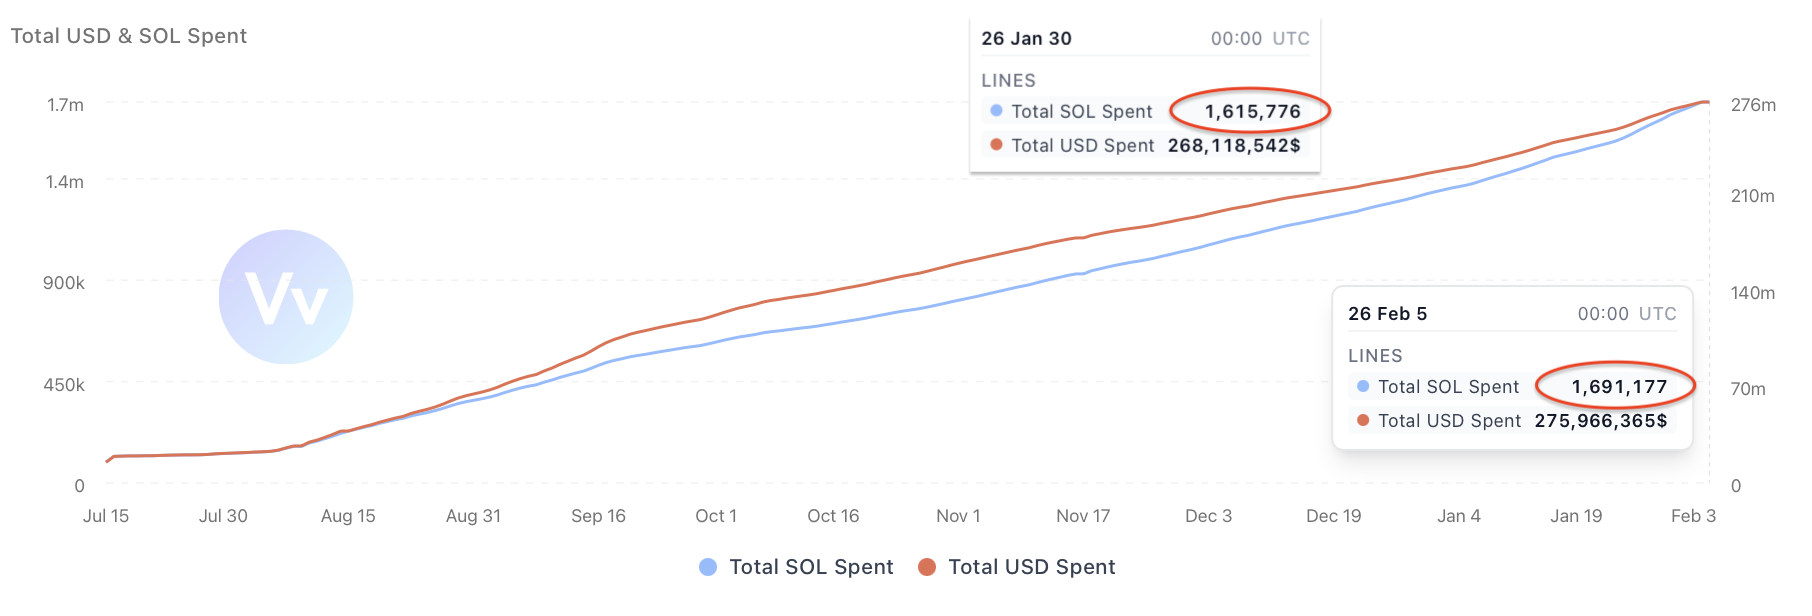
However, the overall amount of fees spent for buybacks in SOL decreased this week. Memecoins don't generate volume or revenue when the market is depressed.
Weekly Result: Price -33.8%, Fees -17%, 7D Multiplier almost unchanged (1.14x decrement due to price decrease).
Hyperliquid ($HYPE):
This week we updated the $HYPE multiplier calculation methodology. It now accounts for all existing $HYPE tokens for buyback and burn activities. We assume that all existing tokens benefit from buybacks. However, revenue-driven buybacks and HyperCORE/EVM burns are be subtracted from the supply.
Hyperliquid generated significant revenue from recent volatility peaking with >$5M at 5 Feb:
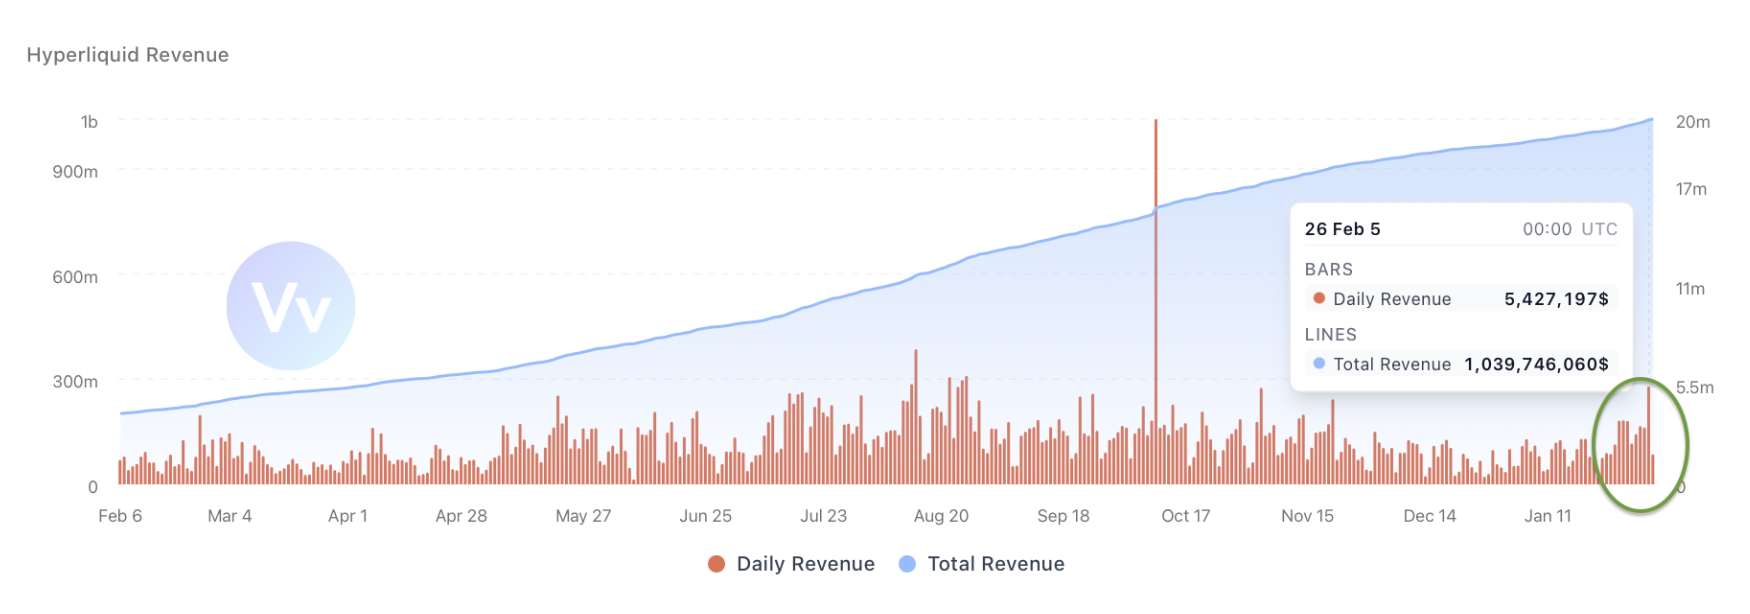
However, average revenue in July/August was bigger. During this market crash $HYPE is one of rare tokens whose price grew, not declined. It means that market prices this revenue and future growth expectations.
Weekly Result: Price +17.3%, Fees +87%, multipliers comparison isn't available due to methodology update (7D-365D* multipliers ~17-21.75).
AAVE ($AAVE):
This week, Aave bought back more AAVE than the previous week (8,702 vs. 5,710). This occurred due to the significant decline in AAVE's price and the absence of buybacks on January 23rd and 24th (the previous 7D period). Typically, buybacks are performed consistently, with a similar amount of USD spent per period. However, days without buybacks also occur.
The Safety Module revenue remains the same since it distributes revenue from allocated AAVE rewards according to the reward schedule.
Weekly Result: Price -23%, amount of purchased $AAVE week-to-week +52%, buyback multiplier significantly decreased (3.13x decrease).
Uniswap ($UNI):
Uniswap multiplied its revenue this week in terms of buybacked tokens (see the slope of supply decrement curve):
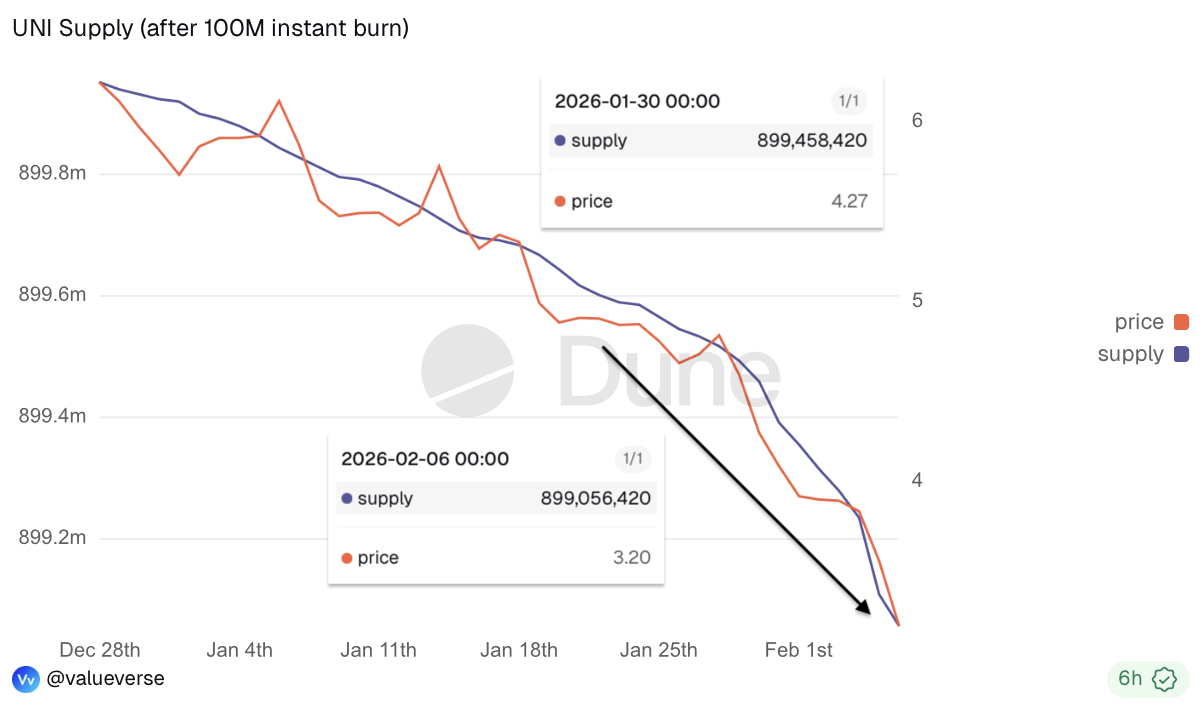
Buybacks were driven not only because of revenue growth, but also due to $UNI price drop.
Chart reflects that buybacks acceleration clearly follows $UNI price decline (the red line).
Weekly Result: Price -20.5%, multiplier decreased by 2.68x. However, $UNI has the most expensive token revenue in the observed set, with 49.7 7D and ~123 365D* multipliers.
The Red Week results
Our conclusions from observed data:
- veTokenomic DEXes ($CRV, $YB, $AERO, and $VELO) literally print revenue from volatility, while token prices declined. Multipliers decreased by 2-10x, meaning revenue is now 2-10 times cheaper than in the previous 7-day period.
- The market efficiently prices the revenue of the $HYPE token (the market even front-runs the revenue growth). It's the only token that grew during the crash.
- The $PUMP demonstrated a decrease in revenue and token price. Memecoin-driven revenue is over in the current market.
- $AAVE & $UNI bought back much more than in previous periods mainly due to token price decline. 7D multipliers reflect that (decreased).
For those who read this far, the cover picture of the article contains an "Easter egg" joke. The first reader who discovers it and provides the correct answer in the Twitter comments will receive a free Valueverse Pro subscription for institutional-grade revenue and multiplier data.
Feedback appreciated
It is an experimental research focused on efficient m.cap/revenue metrics. We are open to feedback in Twitter DMs.
Disclaimer: This article and the accompanying analysis are provided by Valueverse for research and educational purposes only. All token valuation frameworks, metrics, comparisons, and conclusions discussed herein are experimental in nature and may rely on incomplete, estimated, delayed, or incorrect data, as well as subjective assumptions and methodologies.
The presented analyses do not represent definitive valuations, forecasts, or assessments of financial performance, and should not be interpreted as statements of intrinsic value. Digital assets and tokens are highly volatile, and their economic characteristics may change over time.
Nothing in this publication constitutes investment advice, financial advice, legal advice, or a recommendation to buy, sell, or hold any asset. Readers are solely responsible for their own research, risk assessment, and investment decisions.